Steve on Image Processing

June 2nd, 2006

Cell segmentation

Blog reader Ramiro Massol asked for advice on segmenting his cell images, so I gave it a try. I'm not a microscopy expert, though, and I invite readers who have better suggestions than mine to add your comments below.

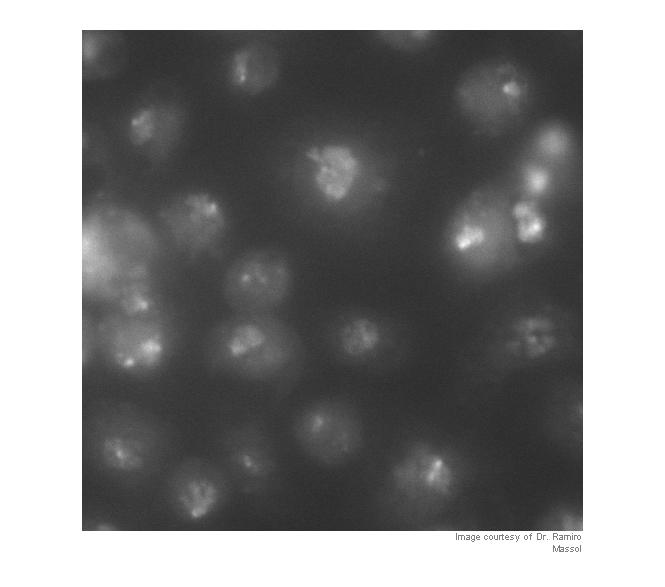
Let's take a look first to see what we have. I'm going to work with a cropped version of the original so that the images aren't too big for the layout of this blog.

Note: you can download the functions imcredit and imoverlay from MATLAB Central.

I = imread('http://blogs.mathworks.com/images/steve/60/nuclei.png');
I_cropped = I(400:900, 465:965);
imshow(I_cropped)
imcredit('Image courtesy of Dr. Ramiro Massol')

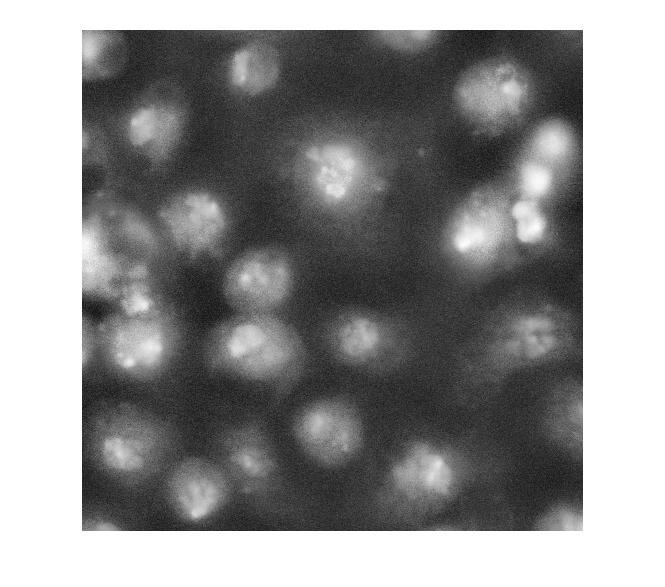
Strictly speaking, contrast adjustment isn't usually necessary for segmentation, but it can help the algorithm developer see and understand the image data better. This is a fairly low-contrast image, so I thought it might help. You can adjust the display contrast interactively with imtool, or you can use an automatic method such as adapthisteq. adapthisteq implements a technique called contrast-limited adaptive histogram equalization, or CLAHE. (I always thought "CLAHE" sounded like it must be some Klingon delicacy.)

I_eq = adapthisteq(I_cropped);
imshow(I_eq)

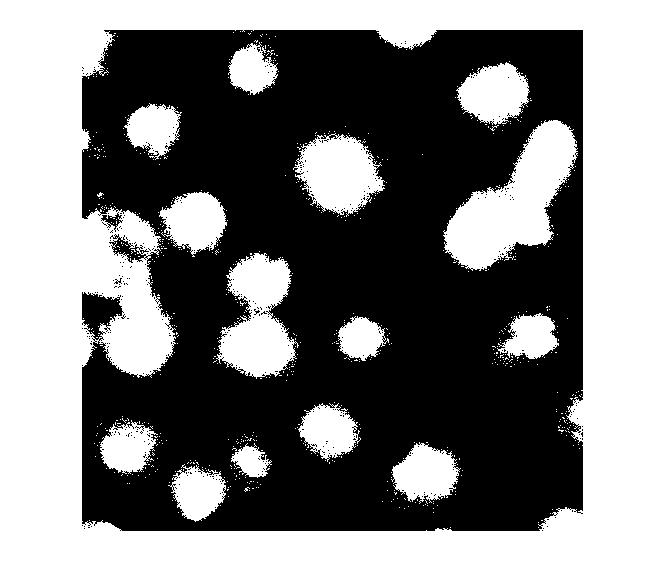
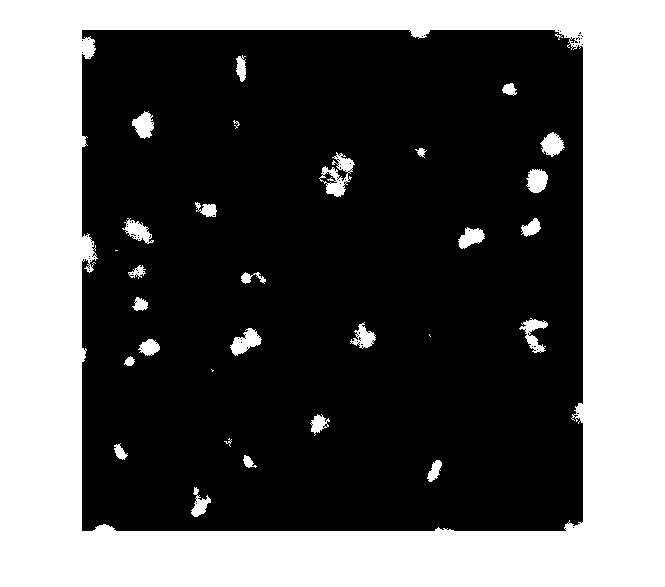
So what happens if we just apply a threshold now?

bw = im2bw(I_eq, graythresh(I_eq));
imshow(bw)

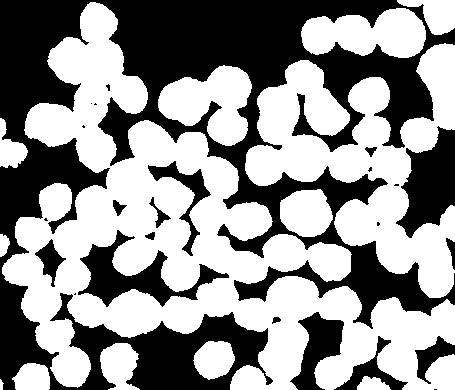
Let's clean that up and then overlay the perimeter on the original image.

bw2 = imfill(bw,'holes');
bw3 = imopen(bw2, ones(5,5));
bw4 = bwareaopen(bw3, 40);
bw4_perim = bwperim(bw4);
overlay1 = imoverlay(I_eq, bw4_perim, [.3 1 .3]);
imshow(overlay1)

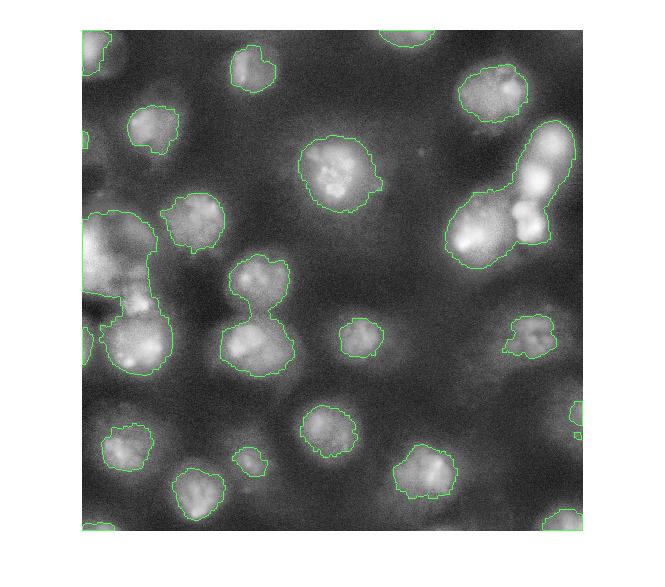
Now, I'm not familiar with these cell images, so I don't know exactly what I'm looking at. I assume some of these blobs need more help to be separated properly. One possible approach is called marker-based watershed segmentation. There's a demo of this idea on The MathWorks web site.

With this method, you have to find a way to "mark" at least a partial group of connected pixels inside each object to be segmented. You also have to mark the background.

Let's try to use the bright objects, which I assume are nuclei. The extended maxima operator can be used to identify groups of pixels that are significantly higher than their immediate surrounding.

mask_em = imextendedmax(I_eq, 30);
imshow(mask_em)

Let's clean that up and then overlay it.

mask_em = imclose(mask_em, ones(5,5));
mask_em = imfill(mask_em, 'holes');
mask_em = bwareaopen(mask_em, 40);
overlay2 = imoverlay(I_eq, bw4_perim | mask_em, [.3 1 .3]);
imshow(overlay2)

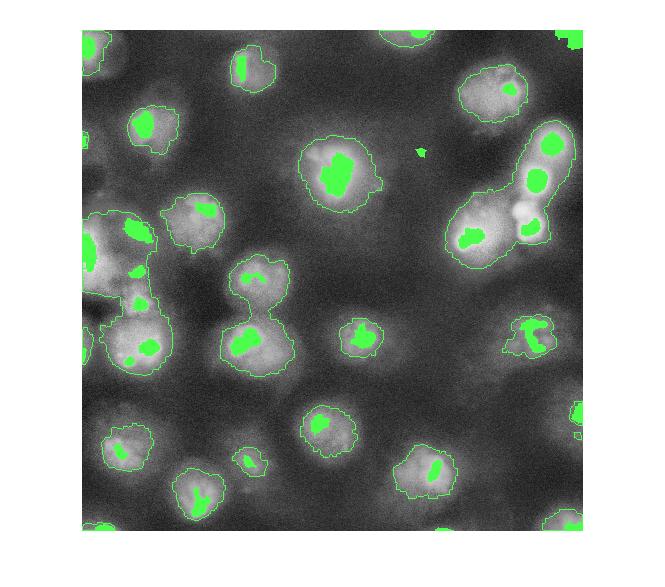
Next step: complement the image so that the peaks become valleys. We do this because we are about to apply the watershed transform, which identifies low points, not high points.

I_eq_c = imcomplement(I_eq);

Next: modify the image so that the background pixels and the extended maxima pixels are forced to be the only local minima in the image.

I_mod = imimposemin(I_eq_c, ~bw4 | mask_em);

Now compute the watershed transform.

L = watershed(I_mod);
imshow(label2rgb(L))

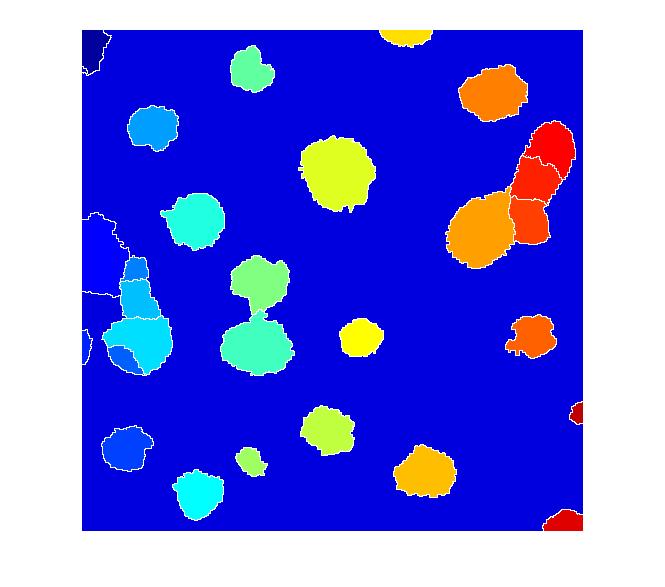
I don't know if this is a good segmentation result or not, but I hope some of the methods I've shown will give Dr. Massol some ideas to try.

Other readers ... if you have suggestions, I invite you to post your comments here.


Get the MATLAB code

Published with MATLAB® 7.2

119 Responses to “Cell segmentation”

  1. kruthika replied on :

    hy…im sorry ….amnt here to give a comment…i am working on splittin and merging algorithms..i find there is some error with the splitmerge.m function given in ‘Digital Image Processing using MATLAB’…Could u please help me…i ve just learnt the basics of image segmentation….

    thnk u…

  2. Steve replied on :

    Kruthika, Rafael Gonzalez knows more about the splitmerge function than I do. You can find contact information for Professor Gonzalez at http://www.imageprocessingplace.com.

  3. ishraq replied on :

    hi everbody,,
    i have a qustion about coins segmentation ,,
    i didn’t find a good way to segment the coins when they are
    connected (the edges of coins are connected).

    any one can help me please???!?!?!

  4. ishraq replied on :

    http://www.cb.uu.se/~maria/undervisning/TODB04/coins.tif
    this is an example for coins image when there is overlapping or connection between coins

  5. Steve replied on :

    Ishraq – I took a quick peek at your coins image. Possibly something as simple as eroding a thresholded image might work. If not, then you might try marker-controlled watershed segmentation. A link to the relevant product demo is given in this very blog posting. You can find it here: http://www.mathworks.com/products/demos/image/watershed/ipexwatershed.html

  6. ishraq replied on :

    Dear Mr Steve ,
    Thanks alot for your fast replaying ,
    but I still have difficulties in using watershed because
    im beginner in using MATLAB,

    I like to add 2 new urls for coin images with overlapping between the edges

    http://www.geocities.com/ishraq2006/1.JPG
    http://www.geocities.com/ishraq2006/3.JPG

    my problem is about how i can segment these coins in a good way so i can use “bwlabel” and “regionprops”
    to recognize the coin types .

    i hope from you to help me to find a way to segment these coins because you are expert person .

    thanks you alot
    ishraq

  7. Steve replied on :

    Ishraq – I’m sorry, but I can’t work this problem out for you, or help you learn MATLAB. Go through the Getting Started in MATLAB guide to get some MATLAB knowledge. Then look at the Image Processing Toolbox Users Guide and the product demos on our web site, including the one I already linked to. Look at the material in the documentation and demos on thresholding, morphological operators such as erosion and opening, and watershed segmentation.

  8. Wilson replied on :

    Hi there,
    I have a query on how to use Matlab for Vehicle Plate segmentation?
    I read from the papers that one solution is to gray scale the picture. But how does the system be so clever to segment out the unwanted parts and leave the vehicle plate untouched?
    Hope to hear from you guys soon.
    Cheers..

  9. subrajeet mohapatra replied on :

    Hi,
    I have read your book but there is nothing about adaptive histogram equalization.Can u give me some ideas or the algorithm for adaptive histogram equalization.So that i can go to CLAHE.

  10. Steve replied on :

    Subrajeet – There is an implementation of CLAHE in the Image Processing Toolbox. See the adapthisteq function.

  11. subrajeet mohapatra replied on :

    can i get the complete algorithm

  12. Steve replied on :

    Subrajeet – The complete algorithm is summarized at the top of the M-file, plus you can always look at the code. The M-file also contains this reference: Karel Zuiderveld, “Contrast Limited Adaptive Histogram Equalization”, Graphics Gems IV, p. 474-485, code: p. 479-484

  13. subrajeet mohapatra replied on :

    Hi,
    is there any built in function to measure signal to noise ratio for images ,My friend is telling there is Peak signal to noise ratio (PSNR) im image processing toolbox

  14. Steve replied on :

    Subrajeet – There’s no PSNR function in the Image Processing Toolbox, but it’s very easy to implement it directly from the formula.

  15. Fabiano Malhard replied on :

    Hi steve,

    I am really new at MatLab and I am trying to work with images, reducing its size and later resizing them using one of the commons methods … but i would like to compare the resulting images with the original ones …

    Can you help with the SNR function, or there is any other better aproach ???

    Thanks

  16. Steve replied on :

    Fabiano – There are several different definitions of SNR used for image comparisons, so the details vary depending on the definition you are interested in. But the heart of the computation, typically something like a mean-squared error, is straightforward in MATLAB. If you are comparing A and B, it might look something like this:

    mse = mean( (A(:) - B(:)).^2 );
    
  17. rosani replied on :

    Steve,
    how to compute a confusion matrix to measure accuracy between two image(rgb,in pixel) from different source.

  18. Steve replied on :

    Rosani—I’m confused; what’s a confusion matrix?

  19. bob gold replied on :

    Hi my name is Bob Gold a pharmacist in Indiana. I
    am interested in developing a method to determine the
    number of tablets in a bottle for the purpose of
    improving compliance. I am not an expert on cameras .

    Do you have any ideas.
    Thanks

  20. Rob replied on :

    Bob Gold,

    I think first of all you’ll need some really wide, flat bottles so the pills are no more than 1 deep in the image. (sorry for the sarcasm, couldn’t resist)

    Other than that, you could take a picture of pills in a regular bottle and compute an *estimate* of how many pills are packed in there. Depending on the pill shape, there are many standard packing computations, such as hexagonal-close-packed, body-centered-cubic, etc. Think lattice structures, but all the ones I’ve studied are for spheres. The main failing here is that you won’t get the real number, which it sounds like you need for compliance.

    Hope this helps,
    Rob

  21. Steve replied on :

    Bob—I don’t anything to concrete to suggest beyond what Rob said. It sounds like it might not be feasible except under very particular circumstances.

    Rob—Thanks for jumping in.

  22. Steve replied on :

    Bob—OK, I do have one thought. I’d be more tempted to use a precision scale instead of a camera and image processing to measure the number of pills. But this kind of quality assurance application is a bit beyond my expertise.

  23. Adnan Butt replied on :

    Hello Sir,
    I am working in MATLAB image processing and one thing I do have explored that most of the commands extracting quantitaive measures work only on 2D matrices there is not much material on 3D image processing in MATLAB?
    Can you guide me in 3d Image processing in MATLAB?
    Regards

  24. Steve replied on :

    Adnan—There are many functions in MATLAB and the Image Processing Toolbox that work on three-dimensional arrays, including filtering, transforms, morphology, and region measurements. Can you be more specific about what you are looking for?

  25. Ben Taylor replied on :

    Improvement: Blobs/particles touching the sides of the images will mess up your size measurements and shape characterization because they are not showing the whole particle. To remove all particles or cells touching the sides I wrote the following simple script that removes any particle touching the border of the image.

    %%%%////
    function L=borderstrip(L)
    display(‘starting border strip’)
    border=[L(end,:) L(1,:) L(:,end)' L(:,1)']; %these are all the pixels for the borders
    background=mode(mode(L)); %this finds the most common pixel for the background which is usually 2

    count=0;
    for i=1:length(border)
    if border(1,i)==2
    border(1,i)=0;
    else
    count=count+1;
    blacklist(count)=border(1,i);
    end
    end
    blacklist=unique(blacklist); % this strips out all of the copied black listed pixels to be removed
    height=size(L,1);width=size(L,2);
    for j=1:length(blacklist)
    for h=1:height
    for w=1:width
    if L(h,w)==blacklist(j)
    L(h,w)=background;
    end
    end
    end
    end
    display(‘ending border strip’)

  26. Steve replied on :

    Ben—You can use imclearborder to remove objects touching the border.

  27. Saad Khan replied on :

    Hi Steve,
    Do you know of any matlab implementation of 3D deblurring (deconvolution)? The matlab image processing toolbox contains four deblurring functions but all of these work with images (2D data).
    Thanks!

  28. Steve replied on :

    Saad—You can use the deconvolution routines in the Image Processing Toolbox. They are not limited to two dimensions.

  29. VEN replied on :

    Respected Sir,
    I am Working in Matlab with Some Videos to Identify Moving
    Object in that Video. I am Working in Matlab7 in which Video
    Processing is not There. Now I am able to Identify the
    moving objects Partially. Could you please Suggest me to Segment only that Moving objects In that Video. And also I want to Count the Number of segmented Object. Please help me in this matter.

    Thanking You,

  30. maged replied on :

    i want functions that make segmantation of nodules in image by matlab
    thanks

  31. Shalin replied on :

    3D deconvolution:

    Hi Steve! Great page… Continuing on Saad’s query, could you help me with pointers on how to represent 3D point spread functions(in my case for optical microscope) and how to employ blind deconvolution.

    Thanks
    Shalin

  32. Steve replied on :

    Shalin—A 3D point spread function is represented as a 3D array containing the impulse response of the blur operator. There is an Image Processing Toolbox function for performing blind deconvolution. Did you have a specific question about it?

  33. Stalin Mohapatra replied on :

    Can you plz give me a complete MATLAB code on MEAN Filtering of Noisy Images?
    It would be kind enough if you send it to my mail. I’ll be ever grateful to u.

  34. Steve replied on :

    Stalin—It sounds like you might just want to use imfilter (or the MATLAB function conv2) with a constant filter, such as ones(5,5)/25.

  35. Adnan replied on :

    Hi Steve, I posted the same query a couple of days ago but I cant see my Post now. Any way, There is a camera on road fixed in one position. I want to count the vehicles passed by the camera. But the problem is the segmentation i.e. to ignore any thing except vehicle. Kindly suggest me some proper algorithm for this problem.
    Thanking in Anticipation
    Regards

  36. Eric replied on :

    Hi Steve, I am trying to create circular and elliptical images as quality assurance tests for my image segmentation code. I can do a simple generate xy coordinates from parametric equations command, but I get a real blotchy image. I’ve figured out that it is because I’m not implementing Bresenham style line algorithums. Does matlab have built in Bresenham line drawing algorithums that can be augmented eaisly to draw nice smooth circles and ellipses in pixelated images?

  37. Steve replied on :

    Eric—As far as I understand, Bresenham drawing algorithms are for drawing shapes blazingly fast, with an absolute minimum of arithmetic, in low-level code. I’m not sure such a thing is really needed in MATLAB, where we get to do all the math we want. For example, the file toolbox/images/images/private/intline.m draws the same line between two pixels that a Bresenham line-drawing routine but, it uses some simple math to do it. So … what do you mean by “blotchy”?

    I would probably “draw” a circle on an image using meshgrid and some sort of distance logic, like this:

    [x,y] = meshgrid(linspace(-1,1,200));
    bw = hypot(x,y) < = 0.25;
    
  38. Wander replied on :

    Dear Sir,
    I want to find out the circularity and cell count of cell images after employing Marker Controlled Watershed transform. (Images are similar to those taken as illustration in this web-page). Can you kindly explain to me how to go ahead in this direction.

  39. Steve replied on :

    Wander—Use bwlabel and regionprops.

  40. walid jerbi replied on :

    Hi Steve,
    I need to merge two regions in a labeled image. I want to know if there is a function that allow mes to do this?
    Regards

  41. Steve replied on :

    Walid—Can you provide a more specific, detailed description of the operation you want to perform?

  42. sherly replied on :

    I am working with counting of cells in an image. I have segmented the cells but i need your help to count the number of cells

  43. deepak replied on :

    count the no: of pixels in the each segmented part

  44. Steve replied on :

    Sherly—If you have already segmented the cells, then use bwlabel to count them.

  45. arindam replied on :

    i am working on segmentation of myocardium and (general countour tracking) of heart from cardiac images . most articles seem to refer to using HMRF(hidden markov fields) and Expectation Maximisation namely

    http://ieeexplore.ieee.org/xpl/freeabs_all.jsp?arnumber=906424

    the images i am working on are available from
    http://atlas.scmr.org/download.html
    specifically akld-mrirg-cines-truefisp-long.zip
    the first set 0f 32 images.(long 1)
    any guidance in the right direction will be appreciated.

  46. Administrator replied on :

    Arindam—I am not familiar with cardiac image segmentation.

  47. Asanka replied on :

    Is there any way to eliminate closely spaced markers of the wathershed segmentation inorder to avoid over segmentation?

    Any suggestions to avoid over segmentation?

  48. Steve replied on :

    Asanka—If you are generating your markers using the minima of something like a gradient image, you might try using something like imextendedmin in order to filter out shallow minima.

  49. TMan replied on :

    I’m trying to calculate the number distinct objects in a huge (about 6000×6000) binary image B.

    [ignore count] = bwlabel(B);

    won’t work because of the double precision ‘ignore’-image not fitting my memory.

    count = sum(sum(bwmorph(B,’shrink’,Inf)))

    is, on the other hand, way too slow.

    Anyone having efficient solutions to this problem?

  50. silvia replied on :

    hi steve,

    I want to measure the area of cell nucleus. Could you explain to me the steps to do that?

  51. Steve replied on :

    TMan—You can start with bwlabel and modify it to suit your needs. Look in the file for the line:

    numComponents = length(sizes);
    

    That’s the answer you are looking for, and that line occurs before the memory-consuming output label matrix is constructed.

  52. Steve replied on :

    Silvia—Once you have the nuclei segmented, you can use bwlabel and regionprops to measure the area. I can’t help you much with the segmentation problem. Image segmentation usually requires some custom algorithm development that depends on the specific characteristics of your data set. Consult texts on microscopy and image processing for some general methods that you might be able to adapt to your data.

  53. JP replied on :

    When I copy this image, save it as a PNG, and try to use it, I get an error. Here is my code:

    ——————–
    %test work with imfill
    I = imread(‘nuclei.png’);
    I_cropped = I;
    I_eq = adapthisteq(I_cropped);
    imshow(I_eq)
    ——————–

    All I’m doing is reading in the image, which I copied from the webpage. THen I get this error:

    ——————-
    Error in ==> imfill_test at 4
    I_eq = adapthisteq(I_cropped);

    ??? Function ADAPTHISTEQ expected its first input, I, to be two-dimensional.
    —————–

    I can use adaphisteq if I read in a GIF or TIF with [X,map]=imread… and then use ind2gray, but the example image on this blog will not work for me at all, evne when saved as a TIF, using the same code that reads another TIF. I’m using R2006b. There must be something I’m missing about the definition of the image or something.

  54. JP replied on :

    Ok, if anybody else had the same problem as me, just make sure you grab only the top 2-D layer of the PNG after you read it in. On my computer it came in as MxNx3 and made adapthisteq choke. When I said I_cropped=I(:,:,1); it picked up a 2-D matrix and was happy with that input.

  55. Steve replied on :

    JP—The second paragraph of this post has a link to the original nuclei.png image for use with this image. The images you see on this web page are automatically captured screen shots from MATLAB, and they are stored in a color format even if the originals are grayscale.

    I have modified the first line of code (the call to imread) to show how to read the correct original image directly, using its URL. I hope this will help others avoid similar confusion.

  56. JP replied on :

    Thanks, Steve! Pesky color images that aren’t color…

    I will keep working to adapt the method to my images. In a nutshell, I have two images of a fuel spray taken with different filters. Each image is zeroed by a dark image, so it is nearly zero outside of the spray itself. The images are stored as matrices and then divided pixel by pixel. Within the spray itself, the resulting data is fine. But outside of the spray, you wind up dividing small noise by small noise and you get pure trash outside of the spray. I’m trying to use the same techniques to outline my spray and make a mask so I can discard everything outside the spray. I’m getting there, but I keep getting tripped up in the difference between matrices, greyscale images and color images. I’ll get it soon. Thanks!

  57. Administrator replied on :

    JP—Sounds like an interesting application.

  58. Rudi replied on :

    Steve:

    Can I use this concept to segment human heads in a crowd scene? But the occlusion problem could be a significant issue for this purpose.

    Thanks

  59. Steve replied on :

    Rudi—The concept of marker-controlled watershed segmentation is quite general, and might apply to your problem. I would expect the details to be very difficult to work out, however.

  60. Chris replied on :

    hi steve,

    thanks for this suggestion of the cell segmentation. i have got a question: have you ever implement the pyramid linking algorithm from J. Burt? i am on a similar problem like this cell segmentation. but we’ve got colonies and sometimes the edges are blurred and sometimes they are sharp! if you want i can send you some pictures of these colonies!?!

    Thanks
    Chris

  61. Steve replied on :

    Chris—No, I’m not familiar with that method.

  62. Rupesh Tatiya replied on :

    Steve,

    I have a similar image segmentation problem at hand where we have the RGB color image of human face and the objective is to segment the eyebrow from the rest of the face. I have tried different algorithms given in various tutorials but they do not work with good enough. So, can you help me in this matter?

    Thanks and Regards,

    Rupesh Tatiya

  63. Steve replied on :

    Rupesh—No, I generally do not have the time available to provide custom algorithm development advice for particular datasets.

  64. Shannon replied on :

    i am not sure if this has already been addressed/answered. I used code like yours, and incorporated what you did for segmentation.

    I need to create code to count the specific cells once thresholded. like that produced a single number of the cell count, like 18.

    i think i need a for loop, but i’m not really strong in matlab, so i was wondering if you knew how to count pixels in order to cell count or what… maybe had sample code or language to steer me in the right direction? THANK YOU!

    shannon

  65. Pradeep replied on :

    Hi Steve
    I am planning to do something on cell segmentation. But I am not an expert. I need your help. I need in areas of calculating more accurate cell density by keeping in mind: Partial Cell, Non-cell area and overlap cell. One more area i want to focus on is auto threshold if you have any ideas regarding this plz let me knw

    Thanks

  66. Steve replied on :

    Shannon—Try this:

    [L, num_cells] = bwlabel(segmented_cell_image);
    
  67. Steve replied on :

    Pradeep—Are your cells reasonably circular? If so, you might consider trying a circular Hough transform. There are many different variations on the literature. There’s at least one available on the MATLAB Central File Exchange.

  68. Pradeep replied on :

    thnx steve
    i have one more question. why we only use black and white image for cell segmentation. like if we have any color image we first convert it to a grayscale.

  69. Steve replied on :

    Pradeep—It is convenient to use a binary (black and white) image to represent the outcome of the fundamental segmentation idea: Choosing which pixels belong to objects of interest, and which pixels belong to the background.

  70. Sam replied on :

    Hi ,
    How can I identify objects with intermediate intensities in a image(there are bright objects, medium bright objects and the background), when the region around the brighter objects(glow around the bright objects) are of similar intensities to the medium intensity objects and needs to be excluded !

  71. Tilman Sauter replied on :

    Dear Sir,

    I have developed a 3D image deconvolution code using the approximate method described in “Digital Image Processing, Castleman”. It uses the out of focus microscope images and the out of focus PSF images to determine the ‘noise’, which is then subtracted from the in-focus micrsocope image.

    Now I would like to use for example the deconvlucy() function provided by Matlab to do the same thing in order to compare both.

    Is it possible to work with out of focus planes in any of matlabs deconvolution functions to achieve 3D image deconvolution?

    Thanks already very much in advance,
    Tilman

  72. Steve replied on :

    Tilman—I don’t have the Castleman reference handy. Can elaborate on what you mean by “work with out of focus planes”?

  73. Tilman Sauter replied on :

    Dear Sir,

    Thank you for your fast reply. The code I implemented is based on a simple equation:
    in-focus-object = in-focus-image – sum(lower-out-of-focus-image convoluted with lower-out-of-focus-PSF + higher-out-of-focus-image convoluted with higher out-of-focus-PSF).
    The sum sign defines the number of adjacent planes used, image the obtained image from the microscope and object the deconvoluted image.

    The important thing is, that I can use information from the adjacent planes to improve the in-focus-object, whereas with deconvlucy() I can only use the information of the in-focus-image and in-focus-PSF.

    Do you think it is possible to use deconvlucy() or another deconvolution function to achieve a comparable result?

    Thanks again for your help,
    With best regards
    Tilman

  74. Steve replied on :

    Tilman—No, none of the deconvolution methods in the Image Processing Toolbox implement that technique. You would need to modify them yourself.

  75. Steve replied on :

    Sam—It’s hard to say without seeing a sample. Sounds like you have a difficult segmentation problem. If the object boundaries are reasonably well-defined, it might be helpful to use the gradient magnitude image.

  76. Jon Hauris replied on :

    Steve, I am interested in texture processing. Is there a way to search your excellent archives to see if you have covered this area and where it is located. Thank you, Jon

  77. Steve replied on :

    Jon—There is a MATLAB Central search box at the top of the page. You can limit the scope of the search to MATLAB Central blogs. Or you can click on the “Blog archive” link in the side panel. I haven’t written that much about texture analysis, though. You might want to try the texture analysis section in the toolbox documentation.

  78. Giles Kingsley replied on :

    Steve,

    I have an image of a metal plate from a time-lapse series. There is a grid in the background, which I want to remove. Does this sound like a morphological operation? Throw me a bone here. Edge detection just enhances the grid, and thresholding removes area(my output) from the plate. Any ideas?
    -Giles

  79. Steve replied on :

    Giles—An opening (IMOPEN) might work. How thick is the grid, and how thick is the object(s) of interest?

  80. IB replied on :

    I get the following error when I follow the commands here
    “Undefined function or method ‘imoverlay’ for input arguments of type ‘uint8′.”
    How could I overcome this error?

  81. Steve replied on :

    IB—The third paragraph in this blog post tells you how to get the function imoverlay.

  82. IB replied on :

    Steve do you mean the cell segmentation blog? I did not found it in the cell segmentation blog

  83. Steve replied on :

    IB—In this blog post, the very one you are commenting on, the third paragraph says “Note: you can download the functions imcredit and imoverlay from MATLAB Central.” The links are provided there.

  84. azhagumani replied on :

    i want to expand a region and find out what are all label values it reached.

  85. Steve replied on :

    Azhagumani—Form a binary image whose foreground is the region you are interested in, and then dilate it. Then use the dilated image as a logical mask into the original labeled image; that will pull out all the labels adjacent to the original labeled region.

  86. huda replied on :

    Hye.. I’m new to this image processing things.. I was told to make an image segmentation of a picture.. The image consists of 3 shapes that overlapping each other.. It was a grayscale image but with 3 different tones of gray colour.. The task was to convert to binary format first and then segment the shape individually.. If during the segmentation, the shape missing some portion, I have to complete the missing portion.. So, can you tell me how to do it in Matlab? And I wonder do I have to set a threshold value?

  87. Steve replied on :

    Huda—It’s difficult in general to reconstruct overlapping shapes in a segmentation problem. It’s easier for some specific shapes, though. For example, if your shapes are circles, you could use a circular Hough transform. Hough-like algorithms can often detect a partially occluded shape. The Image Processing Toolbox does not have a circular Hough algorithm, but there’s at least one available on the MATLAB Central File Exchange.

  88. huda replied on :

    The shapes are circle, square and rectangle.. Can i used the Hough transform for these shapes? And for the segmentation? How to do it?

  89. Steve replied on :

    Huda—The problem sounds kind of contrived. I don’t have any particular suggestions.

  90. Chris Soton replied on :

    Hi Steve,

    I am MATLAB beginner and I am using a similar image to this example. I have converted my nuclei image to binary and used bwlabel to count the nuclei. However I would like to measure the distance between cell nuclei from a central point on each nuclei (centroid), but I am struggling with the code. Is there any coding help or pointers you could give me with this please?

    Thanks,

    Chris

  91. Steve replied on :

    Chris—You can pass the output of bwlabel to regionprops to get the centroid of each labeled object.

  92. ragu replied on :

    hi, steve
    i want to develop a general algorithm for image resulting from watershed to display how many pixel occupied in each segment and average intensity of each segment .so that i need variables to sum up the the pixel and average intensity. for limited segment i can develop with specific variables but for generalize i need to get variables which should generate depends on how many segments from watershed output.

    please help me with code to get continuous variables.

  93. Chris Soton replied on :

    Hi Steve,

    Thanks for the reply, I am sorry but I think I was not clear. I have obtained the centroids of my cells and am struggling to get the distance between the centriods. I would like the code to automatically get the distance between all centriods.

    I have tried imdistline but this seems to be a manual code and my attempts to pass the centriod data to this code have failed. Please could you give me any sample code or pointers?

    Thanks,

    Chris

  94. Steve replied on :

    Ragu—You can pass the output from watershed to the function regionprops in order to calculate the desired measurements for each labeled region.

  95. Steve replied on :

    Chris—Try something like this:

    dist = hypot(centroid1 - centroid2);
    
  96. Stefan replied on :

    Hello Steve!

    First of all I’d like to say that I very appreciate your Help here in this Blog. You’re amazing!
    I have a similar problem like those discussed here. I have an Image where you can find lots of small cruxes (+), which are all different orientated. I would like to get a contour on every single crux, like you did it on the cells on top of this site. My problem is that i cant isolate the cruxes so i always get connected regions.

    The image is here: stud.unileoben.ac.at/~m0335168/RC7.jpg

    Please, help me!!!

    Thanks a lot!

  97. Steve replied on :

    Stefan—I’m sorry, but I don’t have specific suggestions for you.

  98. Chris Soton replied on :

    Thanks Steve! Your code combined with another of your examples has helped me greatly.

  99. Ragu replied on :

    hi steve
    right now i dont have imoverlay function in 6.5.1 version

    can you give any function to do the same

    or how to develop algorithm

  100. Steve replied on :

    Ragu—Please look near the top of this post, where the link is given for downloading imoverlay from the MATLAB Central File Exchange.

  101. kavitha replied on :

    Hi Steve.
    Its a great page. I got answres for a lot of questions. and in my project i have two images for a same object. I ve segmented those two objects. but i need to calculate the area difference between those objects. how can i do this. pls help me.

  102. Steve replied on :

    Kavitha—Use bwlabel and regionprops.

  103. kavitha replied on :

    k. steve…. thank u for ur reply. i refered the page which u wrote abt bwlabel.Ur work and discussion are very useful to students like us.. Those examples helped me a lot…

  104. Ragu replied on :

    hi steve thanks for the reply

    now i have two questions .

    1.how many ways are there to make markers.

    2.i need to make marker on my gray image before apply to watershed in order to segment the defects(black in color).

    where should i make marker either on black parts or gray parts.

  105. Steve replied on :

    Ragu—Take a look at the marker-controlled watershed segmentation demo in the Image Processing Toolbox (you can also find it on our web site). You might also be interested in my watershed article in News and Notes from a few years ago.

  106. ragu replied on :

    in water marking
    fore ground marking is based on the imregionalmin or imregionalmax followed by imclose ,imfill, bwareaopen.

    in back ground marking i have little confussion of super imposing fore ground and back ground marker images on gradiant magnitude image rather than original gray image.

  107. Steve replied on :

    Ragu—I’m not sure exactly what your question is. Whether to use the original image, the gradient magnitude image, or some other derived image depends on your data set and your chosen method for extracting markers.

  108. ragu replied on :

    hi steve thanks for the question,
    i have made foreground markers and background markers as per my region of interest.

    now should i impose these on original image or gradiant magnitude image.

    in example of matlab watermarking it mentioned magnitude gradient.
    why?

    i belive that imposing markers on original gray image is logically good. if it is not .why?

  109. ragu replied on :

    im sorry i forgot to mention that ,my ultimate aim to get segmentation of defects on gray image which is in dark portion ,by applying watershed transform.

    for this i need markers to reduce oversegmentation, .

  110. Steve replied on :

    Ragu—In my comment #105, I gave a link to my News & Notes article on the watershed transform, which explains the basic concepts of using the transform for segmentation. I encourage you to take a look at it. Here’s an important sentence: “The key behind using the watershed transform for segmentation is this: Change your image into another image whose catchment basins are the objects you want to identify.” Often, the original grayscale image does not have the property that its catchment basins correspond to the objects you are trying to segment. Markers, minima imposition, computing gradient magnitudes, etc., are all techniques for making that happen.

  111. Pratyusha replied on :

    HI Steve,
    I have a similar problem with segmentation of tumors in an Ultrasound image.
    I use a .jpg image file and edge detection techniques, but most of the times it does not work, as the background of an US image is not that clear, i.e., there is a very smooth gradient. I could send/upload some of the files (Images) so you can have a look at them.
    Please suggest a suitable edge detection technique for these kind of images.

    Thank you!

  112. Steve replied on :

    Pratyusha—I don’t have any suggestions for you.

  113. Pratyusha replied on :

    Thank you for letting me know. I will try to use a kalman filter for it, or color code the image to highlight the tumor areas.

  114. Francesco replied on :

    Goodmorning,
    in my engineering degree study i have to make a microstructural characterization of open cell aluminium foams.
    After i have done a watershed transform on my 2D slice i have to do a masking of the complement of the binary starting image and the watershed one to reduce the oversegmentation but i don’t know how to make this.

  115. Steve replied on :

    Francesco—This blog post has some example code. You might also want to look at the watershed segmentation demo in the Image Processing Toolbox.

  116. Francesco replied on :

    I=imread(‘Open cells aluminium foam.tif’);
    thresh=40;
    BW=(I>40);
    D=bwdist(I1,’euclidean’);
    D1=imcomplement(D1);
    H=imhmin(D1,13,6);
    L=watershed(H);
    d=imcomplement(BW)&L;
    Now i have reconstructed my open cell foam but if i want to make a geometrical analysis it seems to be that the image has only one region instead of hundreds,because matlab doesn’t recognize that there are many regions.
    How i can make to solve this problem??

  117. Steve replied on :

    Francesco—It’s your algorithm that doesn’t recognize that there are many regions. It’s hard to say for sure without looking at your image, but I’m not sure I understand why all your steps make sense. You might want to take a look at my News & Notes article about watershed-based segmentation.

  118. deXter Holland replied on :

    http://img3.imageshack.us/my.php?image=sample01.jpg

    hi all! i need to do cell detection on the image above (identify the presence of those ‘big’ cells). my main problem is the background (noise), i couldn’t remove them properly, so i couldn’t do the usual segmentation easily. for now i’m processing it on grayscale, based on the materials i’m reading.
    any suggestion?

  119. Steve replied on :

    Dexter—You might try using bwareaopen to remove the small “noise” objects detected.


MathWorks
Steve Eddins is a software development manager in the MATLAB and image processing areas at MathWorks. Steve coauthored Digital Image Processing Using MATLAB. He writes here about image processing concepts, algorithm implementations, and MATLAB.

These postings are the author's and don't necessarily represent the opinions of MathWorks.