
linkaxes
Toward the end of last year, it occurred to me that I had accumulated enough material on this blog to construct a "master class" on image processing in MATLAB. The response to my suggestion was "Sounds good - here's a list of places we want you to go!"
So in a perverse way, it's the blog's fault that I've been slow posting recently. I've been frantically preparing a new image processing seminar, which I'll be presenting at the University of Illinois at Urbana-Champaign and at MIT later this week. (Please, no more snow storms for a few days!)
Have you ever heard of the linkaxes function? We introduced it to MATLAB several releases ago, sometime around version 7.0. It lets you plot into two different axes objects and then keep those axes automatically synchronized with each other. For example, as you zoom and pan in one axes, the other axes zooms and pans the same way. This is really useful for comparing input and output images.
Here's an example using linkaxes to examine closely the output of the edge function.
I = imread('rice.png');
imshow(I)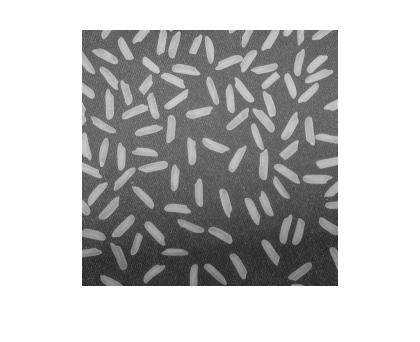
bw = edge(I, 'canny');
imshow(bw)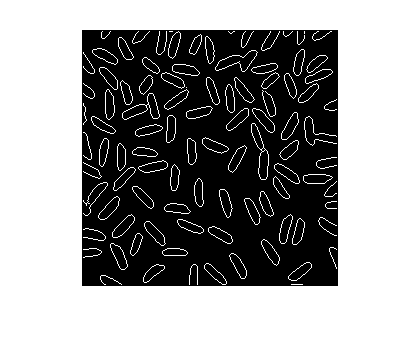
Let's use subplot to create two axes in the same figure, and then we'll link them together.
% Call subplot with an output argument to capture the axes
% handles, because we'll need the handles in the call to
% linkaxes.
ax1 = subplot(1, 2, 1);
imshow(I)

ax2 = subplot(1, 2, 2);
imshow(bw)
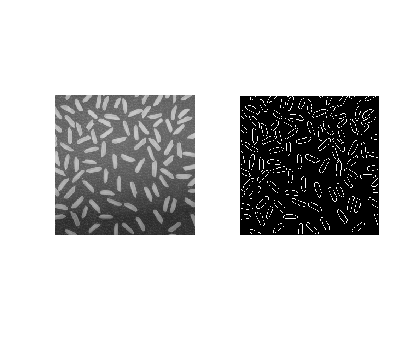
Now pass linkaxes a vector containing both axes handles.
linkaxes([ax1 ax2]);
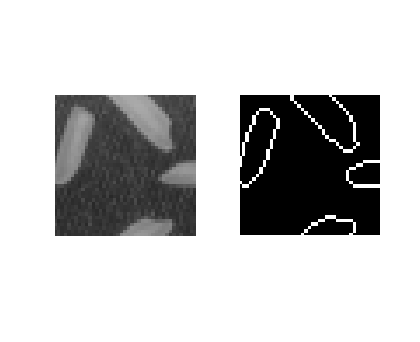
If you then pan and zoom using the mouse in one image, the other image follows along. The linking also works if you change the axes limits from the command line, like this:
axis([50 90 200 240])
There's your quick tip for the week. I hope to pick up the blogging pace again starting next week.


Comments
To leave a comment, please click here to sign in to your MathWorks Account or create a new one.