Profiling using run configurations
We talk a lot about work flows here on the Inside the MATLAB Desktop blog, as well as ways you can streamline your interactions with MATLAB. For the Editor-centric folks in the audience, here’s a great way to integrate Profiling into your workflow using run configurations.
Profiling run configurations will let you tweak the performance of your code more iteratively. You’ll be able to work from the Editor, press the run button, inspect the performance, and then go right back to your code to tweak it.
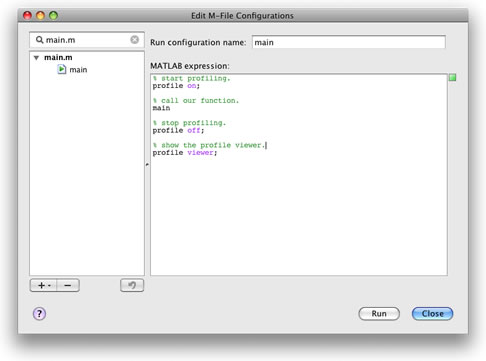
To setup a profiling run configuration, start by opening the file you’d like to improve the performance of in the MATLAB Editor. Then, open the Configuration Editor by pressing the drop-down arrow on the run button  , and select Edit Run Configurations for [your file]. In the MATLAB Expression area, put the following commands, where your_function is the function to profile:
% start profiling.
profile on;
% call your function here.
your_function
% stop profiling.
profile off;
% show the profile viewer.
profile viewer;
Which should look something like this:
Close the Configuration Editor when your done.
Back in the Editor, you can click the run button  (or press F5) and your code will be profiled. The Profiler will popup after running your function, so you’ll be able to immediately inspect the results, teak your code and re-run your function. To prevent the Profiler from obscuring the Editor, try docking it in the Desktop. This is a great technique for iterativley improving your code’s performance.
Check out the MATLAB documentation for more information on the profile function.
- Category:
- Configuration Editor,
- Editor


Comments
To leave a comment, please click here to sign in to your MathWorks Account or create a new one.