Visual debugging with Linked Plots
I’d like to welcome guest blogger Ken Atwell from the MATLAB Technical Marketing team. Ken will occasionally be blogging here on the Ken & Mike on the MATLAB Desktop blog.
Linked plots were introduced in MATLAB R2008a (see the introductory blog entry here). If you are unfamiliar with linked plots, it is definitely a feature worth exploring. While linked plots were introduced primarily to support visual data exploration and manipulation, I’d like to write a bit about a fringe benefit.
Because linked plots are automatically refreshed with current data whenever MATLAB stops, they can be a great visual aid for debugging algorithms. Here I’ll use a linked plot to help me track down a bug in a bubble sort algorithm I ported to MATLAB (this begs the obvious question of why one needs to write their own sort when MATLAB already provides an excellent sort function, but this is just a demonstration). First, I Google’d “bubble sort C source code” and then converted the C source of the first hit to a MATLAB equivalent, remembering that MATLAB has 1-based indexing while C is 0-based. I get a function that looks something like this:
function A = bubbleSort (A)
    for i=length(A)-1:-1:1
        for j = 2:i
            if A(j-1)>A(j)
                tmp = A(j-1);
                A(j-1) = A(j);
                A(j) = tmp;
            end
        end
    end
end
If you are eagle-eyed, you may have already noticed that I didn’t get the conversion from 0- to 1-based indexing quite right. If you test this code you will see that the list is not correctly sorted:
>> issorted(bubbleSort(rand(100,1)))

ans =

     0
To trouble-shoot this code, I may choose to set a breakpoint where I actually update the array and run-run-run-run through this code, possibly using the Variable Editor to watch the changes in variable A. This will work, but this process will be tedious at best. Using MATLAB’s plotting capabilities will allow me to visually spot problems much more quickly.
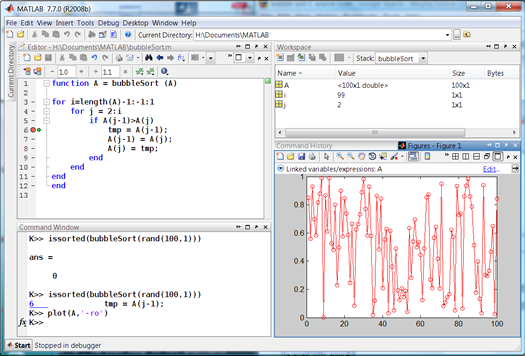
I place a breakpoint at the assignment of tmp (line 6) and issue the issorted command-line above (better yet, I could set up a run configuration if I think I’ll be doing this many times). Even more, I could control the random number stream to make my testing more reproducible). The debugger halts and I plot A:
plot(A,'-ro')
I then link the plot by clicking the  button in the figure window. Now, my desktop looks something like this:
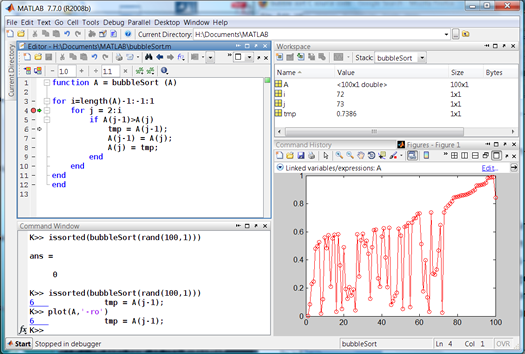
Especially note that the figure window indicates that A is a “linked variables/expressions”. Now I press F5 a few times to run MATLAB, hitting my breakpoint again and again. I can now watch my plot update whenever the breakpoint is hit. But, I set this breakpoint quite deep in my code and I will need to press F5 several thousand times to get through my algorithm. This is too fine-grained for me. I remove this breakpoint and set a new one at the inner for loop (line 4). I run the code 25 times or so and I can see my algorithm in action more clearly:
In fact, I can see the problem now. While the upper-end of A is generally sorted, the very last element is not. I have an off-by-one error that I introduced when I ported the algorithm from C to MATLAB. It turns out that line 3 should be:
for i=length(A):-1:1 % Not length(A)-1 !!!
I make this change, rerun my issorted command and run-run-run to confirm that my change was a good one.
Again, the point here was not to develop a robust bubble sort (better stuff is already built into MATLAB), but to demonstrate how one can use linked plotting to create a visual and dynamically-updating debugging interface in order to help wade through an otherwise vast sea of numbers. Better still, I was able to do this without changing my code, which I am a big fan of.
If anyone else has any experiences with plotting intermediate results for debugging purposes, I would love to hear about them.
-by Ken Atwell, The MathWorks
Editors note: Coincidentally, Doug just posted a similar entry on the same topic! Check out his entry here.
- Category:
- Debugging


Comments
To leave a comment, please click here to sign in to your MathWorks Account or create a new one.