Community Q&A – Kelly Kearney
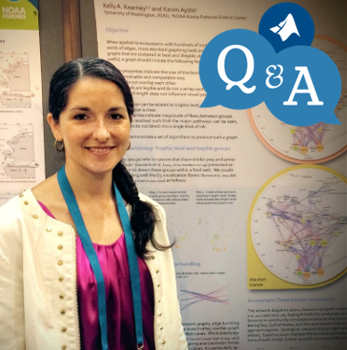
Kelly Kearney is a top contributor to MATLAB Answers and File Exchange. Here is a Q&A I did with Kelly who is a research scientist for the University of Washington in their Joint Institute for the Study of the Atmosphere and Ocean. .

For undergrad, I studied marine science and biology at the University of Miami. I later earned my Ph.D. in the Geosciences department at Princeton University, focusing on ocean biogeochemistry and ecosystem modeling.
I work as a research scientist for the University of Washington in their Joint Institute for the Study of the Atmosphere and Ocean. The joint institute is a partnership between the UW and NOAA (the National Oceanic and Atmospheric Administration); my office is located at the NOAA Alaska Fisheries Science Center (which has its main office in Seattle, not Alaska).
As for what I do… I try to understand the processes that control how matter and energy cycle through the ocean food web, starting from the nutrients dissolved in the water that are then used by microscopic plants that then provide food to a complex web of critters both large and small (including humans). I do this through mathematical modeling of the physics, chemistry, and food webs in the ocean.
I’ll try to break it into pieces a bit. First, the Bering Sea… that’s the body of water between Alaska and Russia, north of the Aleutian Islands. It’s home to the one of the largest fisheries in the world, and provides nearly half the US catches, including the largest single-species fishery, walleye pollock (i.e. the fish used for most breaded and battered fish dishes around the world). So, a very economically-important region. There’s a lot of great field data collected to support the science needed for management of these fisheries. But data collection is mostly limited to summer, and it’s difficult and expensive to get good spatial coverage all the time in such a remote, seasonally-ice-covered region. So models can help us fill in the gaps, learn more about how the system works on a larger scale, and forecast how the ecosystem might change in the future.
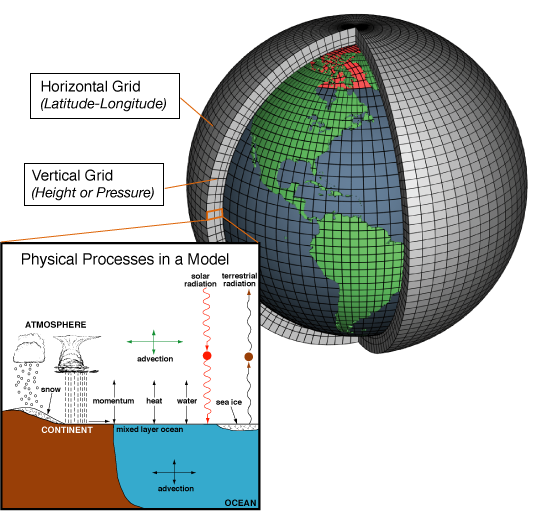
The ROMS model part of that description refers to a high-resolution ocean model. It works similarly to the ocean part of the bigger global climate models. At their core, these models use physical equations for motion on a rotating sphere and thermodynamic energy balance to figure out how air and water move.
(I don’t know what the policy is for adding images to these blog posts, but it’s hard to describe climate models without them… I stole this one from Wikipedia’s General circulation model page: https://en.wikipedia.org/wiki/General_circulation_model).

Coastal areas aren’t able to be well-resolved by the grid cell sizes in global models (1 grid cell ~100 km per side in most global models). So smaller models with finer grids covering the coastal areas are used; ROMS is one such framework. We use the same primitive equations of motion to move the water in our modeled ocean, and also add the chemistry and biology to calculate how well phytoplankton (microscopic plants) can grow, and how many zooplankton can eat them, and how many fish can eat them, etc., etc.
I started using MATLAB for my first job after undergrad, working at the Naval Oceanographic Office, back in 2003. In that job, I was modeling high-frequency sonar performance, i.e. how sound moves through water. My boss gave me some MATLAB scripts written by a previous scientist to analyze the output of our primary sonar model, and I got to work tinkering with it. For context, my previous computer coding experience was all with Fortran and unix shell scripting. Fortran may seem like an ancient language to many computer scientists, but it’s still the workhorse language of scientific numerical computing; the sonar model I used at that time was in Fortran, as are the ROMS model and all the global climate models I mentioned above. Fortran is fast and powerful, and one of the few choices available for high performance computing… but it is not exactly user-friendly, especially for an undergrad without any formal programming classes under her belt. I spent so much time during my undergrad research trying to debug unclear error messages, fix code, recompile, over and over, in my first venture into scientific coding.
By contrast, MATLAB seemed so friendly! Immediate feedback! No compilation necessary! Visual inspection of variables! And plots! So many plot options! I’m a very visual thinker, and like to slice and rearrange and plot data to my heart’s content when wading through complex datasets. Unlike Fortran, and other languages I’d briefly fiddled around with (perl, javascript), MATLAB seemed to think like me. I loved it.
As I mentioned, I didn’t have any formal training in programming. That’s true of most scientists; we learn by looking at other people’s older code, and fiddling with it, and googling a lot. That led me to the MATLAB Newsgroup, which at the time was a part of the MATLAB Central website alongside File Exchange. Originally I used the Newsgroup to figure out specific problems I encountered, but after a month or two it became part of my morning routine; every morning I’d start work by checking email and browsing the newsgroup for 15-20 minutes. I started to learn the fundamentals of good programing, beyond just “make it work”, and storing away tidbits of MATLAB knowledge that might come in handy down the road. I continued that routine through my three years in that job and then into grad school; I migrated to MATLAB Answers when it started eclipsing the Newsgroup (RIP CSSM). Though my time is more limited these days, I still browse Answers when I need a mental break, am waiting for code to finish running, etc.
It’s the primary tool I use for, well, everything. I’ve built several numerical models in it to run various experiments, and do almost all my data analysis and visualization in MATLAB. I even made my wedding seating chart in MATLAB, much to everyone’s amusement! I’ve learned other languages now, and will move to those if there’s a specific need (R is favored for fisheries statistics, python is better when I need to set up batch jobs on the supercomputer), but MATLAB is still my go-to default.
I started using git for two reasons. The first was to keep track of changes I made to my code. One of the advantages to being a self-taught coder is that you get the chance to “discover” the need for certain things by doing it the wrong way first. During grad school, my previous methods for saving backup copies of things before making any major changes to code started getting hopelessly complex, and I decided there simply *must* be a better way to do that. That led to my discovery of version control software, and git seemed to be the consensus favorite at the time, so I started using it.
The second advantage of git is that it allows me to sync my MATLAB library across computers. At first I was wary of making unpolished code publically-accessible, so all my git repos were local and private. But that was a hassle to maintain, and I started moving a few repos to GitHub, and eventually started making them all public. It turns out there’s too much code out there to worry about people judging unpolished code; the repos people tend to find and use are the ones I intentionally publicize
I use the File Exchange as a curated exhibition of what I consider to be my most useful functions. These are functions I’ve taken the time to fully polish, test across MATLAB versions and operating systems, and add documentation. It’s a small collection, and I always intend to add more to it, but unfortunately, my time is limited.
As I mentioned, GitHub is where all my code goes; I’ve got over 150 repositories sitting there, mostly MATLAB stuff. I have a system of scripts on my local computer that I use to keep my local changes synced to their GitHub remotes. This is mostly for my own benefit, so I can get to it from anywhere, but it comes with the nice side benefit that I can easily point others to it if I think it could be useful to them. I save File Exchange for my most popular functions. Technically, all my File Exchange entries are linked to GitHub, so my workflow is the same for all entries, but posting on the File Exchange for me is a commitment to keep the code working and documented to the level needed by public users, rather than just myself.
I’m rather proud of my ecopath_matlab: A Matlab implementation of Ecopath, a food web model mostly used in fisheries science. It’s to date my only project utilizing MATLAB classes, and I think I did a nice job of consolidating some very convoluted, GUI-constrained, pre-existing code into an elegant, flexible, command-line tool. But that code is targeted at a very niche audience who unfortunately don’t use MATLAB much (fisheries scientists are R devotees). Oh well, I get a lot of use out of it myself. :-)

Regarding functions with wider reach, legendflex.m: a more flexible, customizable legend and contourfcmap: filled contour plot with precise colormap remain two of my most popular. These are utilities to expand on MATLAB’s legend and contourf capabilities, respectively. And they’re the ones that I get complimented in person on the most, by colleagues who say, “hey, I was looking for a tool to do this thing, and I found your code and it did the thing!”
I usually turn code into functions as soon as I find myself repeating a sequence of commands more than a handful of times. I once read advice (probably somewhere on CSSM) that you should code as though two people are going to use the code: you, and you 6 months later. That’s more or less all I’m doing… writing code for future me. And future me gets very annoyed by opaque, obfuscated code; that means I add in header documentation of inputs and outputs immediately, and try to keep code neat and tidy with lots of comments and ample use of whitespace for visual organization.
Occasionally, a piece of code turns into something useful for people besides just me, and if I happen to have the time, I write a more doc-like script for those that fully details the syntax and goes through a few examples; this then gets published to both html and GitHub markdown format and appears as the README in the GitHub repo for that function.
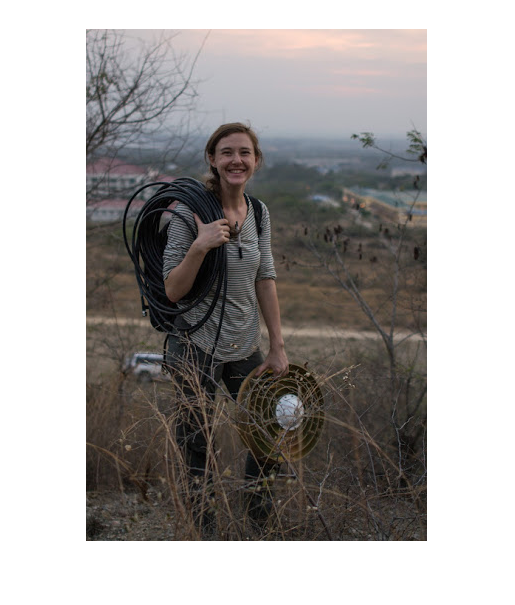
I like to get involved in a little bit of everything! Rec sports, theater and dance, intermittent running of 10Ks and half-marathons… Right now, I play trumpet in a community band, take regular ballet classes (a lifelong hobby) at a local studio, and am slowly gaining some skills in various circus-y endeavors, mainly aerial silks. The aerials thing is a newly-acquired hobby since moving here; there’s a very active circus scene in Seattle that supports both professional and amateur performers (I’m firmly in the latter category!), and I’m really loving it! I also like taking advantage of the beautiful scenery around here to hike and backpack in the Cascades and Olympics with my husband, though mostly in the summer months.

- 범주:
- Q & A


댓글
댓글을 남기려면 링크 를 클릭하여 MathWorks 계정에 로그인하거나 계정을 새로 만드십시오.