
The Perils of Obliquity
You might think you don't care about spherical geometry, but really you do. Because spherical geometry is where you live.
This is a story of the real-world complications of three dimensional projections from one great circle to another. It's also a good example of why I love MATLAB. I can puzzle about an interesting problem, then use my favorite technical computing tool to come to a deeper understanding. I'm going to bring you along on a ride with me as we explore something that I think about every December: the mysteries of the shortest day. Along the way, we'll savor some MATLAB morsels. Lucky you! Buckle up.
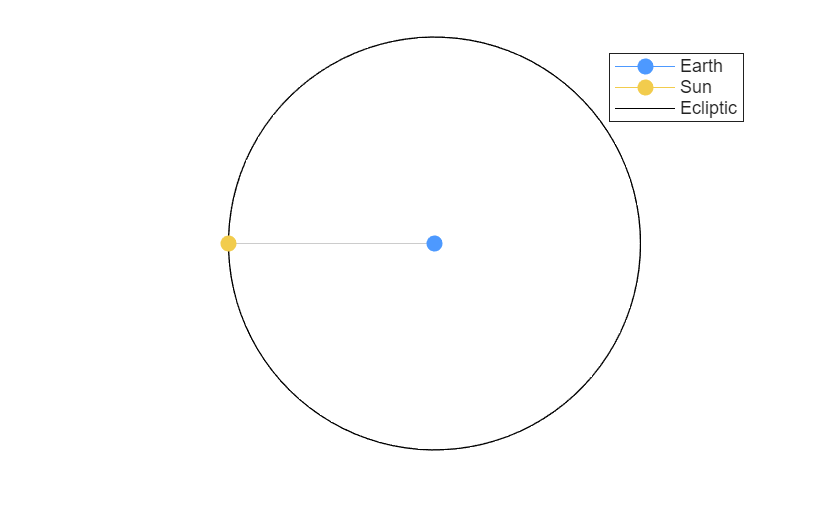
Here's a picture of the sun and the earth at the solstice.
t = linspace(0,2*pi);
ct = cos(t);
st = sin(t);
clf
heq = line(ct,st,0*t,Color="black");
earth = [0 0];
sun = [-1 0];
line( ...
[earth(1) sun(1)],[earth(2) sun(2)], ...
Color=0.8*[1 1 1])
he = line(earth(1),earth(2), ...
Marker=".",MarkerSize=24, ...
Color=[0.3 0.6 1]);
hs = line(sun(1),sun(2), ...
Marker=".",MarkerSize=24, ...
Color=[0.95 0.8 0.3]);
axis equal
axis off
legend([he,hs,heq],{"Earth","Sun","Ecliptic"})
After one spin on its axis, twenty-four hours later, the sun is here relative to the earth. A day has passed.
t2 = linspace(pi,1.5*pi,5);
ct2 = cos(t2);
st2 = sin(t2);
sun = [ct2(2) st2(2)];
line([earth(1) sun(1)],[earth(2) sun(2)], ...
Color=0.8*[1 1 1]);
set(hs,XData=sun(1),YData=sun(2))
legend([he,hs,heq],{"Earth","Sun","Ecliptic"})
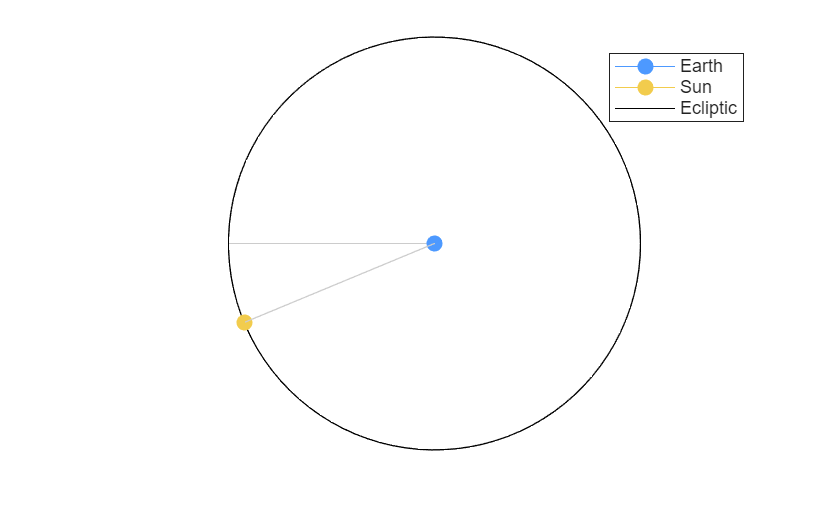
Okay, I admit I'm making it look like the sun goes around the earth, but relatively speaking this is true enough. The sun icon is indicating the direction of the sun from earth's point of view. This geocentric view makes the diagrams simpler. Also, I'm making the days abnormally long. Pretend there are exactly 16 days in year. So there are only 4 days between the solstice and the equinox.
The plane in which the earth moves around the sun (represented by the black circle we see here) is called the ecliptic.
for n = 1:length(t2)
line([earth(1) ct2(n)],[earth(2) st2(n)], ...
Color=0.8*[1 1 1])
end
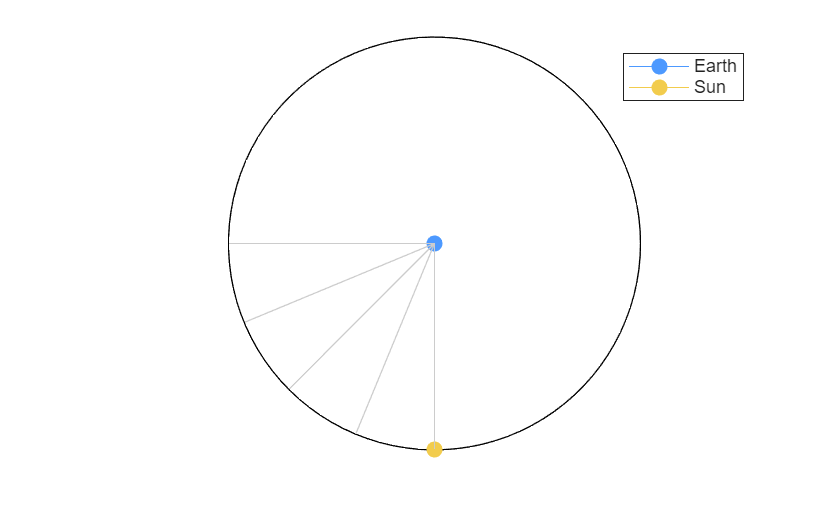
sun = [ct2(end) st2(end)];
set(hs,XData=sun(1),YData=sun(2))
legend([he,hs],{"Earth","Sun"})
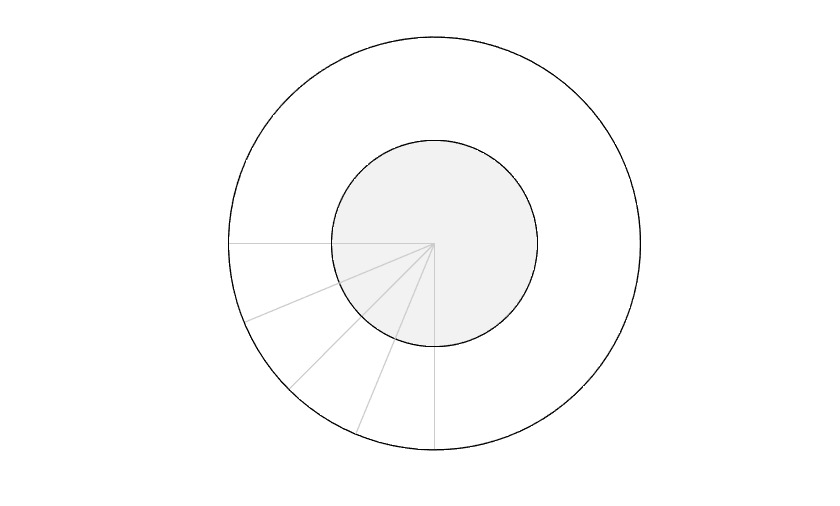
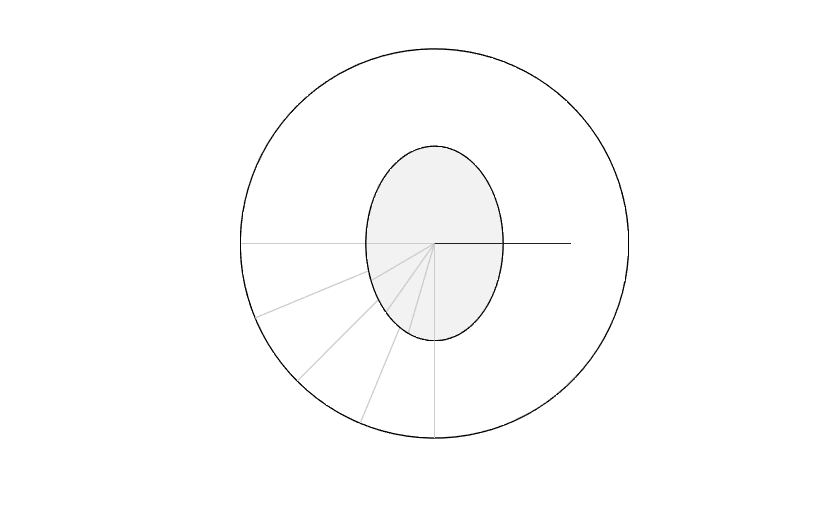
The earth rotating on its axis determines how long an hour is. This is the "clock plane" (also known as the equatorial plane). The earth's motion around the sun determines how long a year is. This is the "year plane" (the ecliptic plane). In the diagram below, the outer circle is the ecliptic plane and we've added a gray inner circle for the equatorial plane.
As you know, the earth is tilted relative to the ecliptic plane. This angle between the equatorial plane and the ecliptic plane, called obliquity, is approximately 23.4 degrees.
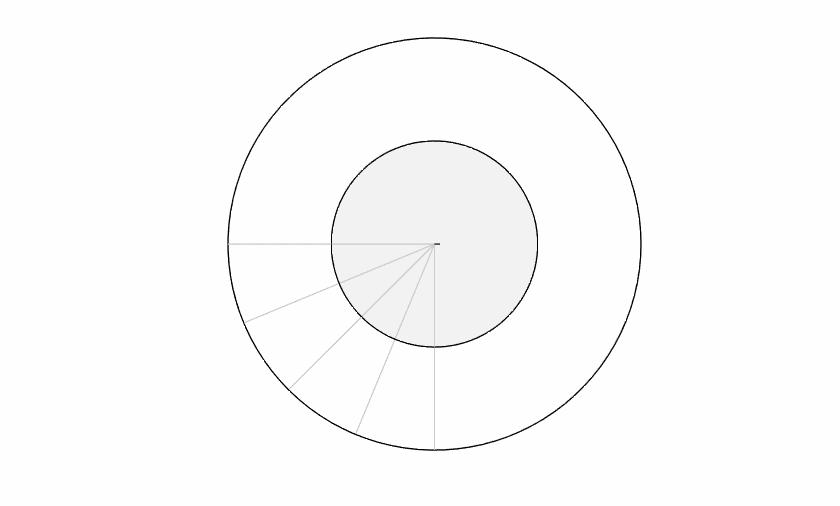
But first let's consider how things would look if there was no axis tilt. The equatorial plane would be coincident with the ecliptic. There would be no seasons. No solstice. No equinox (or rather, never-ending equinox). A little boring, maybe, but the astronomical calculations would be a breeze. The days marked off on the equatorial plane perfectly match the same days marked off on the ecliptic.
clf
hecl = line(ct,st,0*t, ...
Color=[0 0 0]);
for n = 1:length(t2)
line(ct2(n)*[0 1],st2(n)*[0 1],[0 0],Color=0.8*[1 1 1])
end
hgt = hgtransform;
heq = patch(0.5*ct,0.5*st,0*t, ...
FaceColor=0.95*[1 1 1],EdgeColor=[0 0 0], ...
Parent=hgt);
hpole = line([0 0],[0 0],[0 1],Parent=hgt);
for n = 1:length(t2)
line(ct2(n)*[0 0.5],st2(n)*[0 0.5],[0 0],Color=0.8*[1 1 1],Parent=hgt)
end
axis equal
axis off
But now let's add the axis tilt to the equatorial plane. I'm going to exaggerate the tilt here to emphasize the discrepancy.
Oh, and watch how I use HGTRANSFORM to rotate a bunch of objects in 3-space in one slick maneuver! HGTRANSFORM is a favorite of mine.
The key thing to notice here is that the gray "noon" lines no longer match up. That means 24 hours (one notch on the inner circle) doesn't match the time from solar noon to solar noon (one notch on the outer circle). The day length is literally stretching and shrinking! You can also see that the lines do match on the solstices and the equinoxes.
epsilon = 45; % Actual epsilon is only 23.4 deg
rot = makehgtform(YRotate=deg2rad(epsilon));
set(hgt,Matrix=rot)
It's a little hard to visualize what's going on from this top view. Let's look at things from the side.
view(3)
view([15 20])
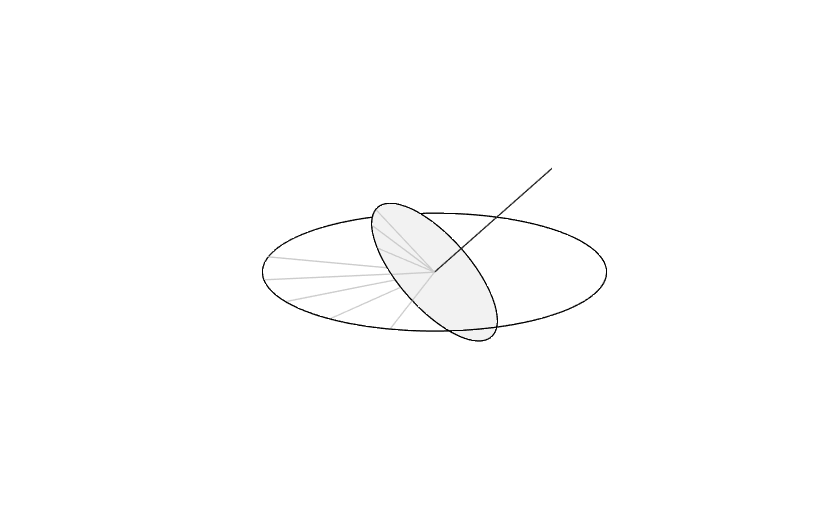
This is the punchline: we have two competing ways to define a day: the time between successive noons, which varies with the season, and exactly 24 hours, which is constant throughout the year. Things look good at the solstice and the equinox, but significantly off in between.
This is a real effect. Solar days vary in length. Obliquity contributes to the so-called Equation of Time which spells out when the sun is running ahead of or behind what the clock says.
The code below will generate an animation. I'll paste in the corresponding GIF-file.
for epsilon = 45*sin(linspace(0,pi))
rot = makehgtform(YRotate = deg2rad(epsilon));
set(hgt,Matrix=rot)
axis([-1 1 -1 1 -1 1])
view(2)
drawnow
end
How bad is the discrepancy? Up to 10 minutes at its maximum. Let's try a couple of alternative tilt scenarios. If the earth was tilted ten degrees more, the solar noon would be up to 20 minutes out of sync with the clock.
clf
t = linspace(pi,3/2*pi);
discrepancy = zeros(size(t));
for epsilon = [13.4 23.4 33.4]
m = makehgtform(YRotate = deg2rad(epsilon));
for n = 1:length(t)
p1 = [cos(t(n)); sin(t(n)); 0; 1];
p2 = m*p1;
% Dropping the z term effectively projects the vector onto the x-y plane
p2(3) = 0;
% Now find the angle between the two vectors
v1 = p1(1:3);
v2 = p2(1:3);
discrepancy(n) = atan2(norm(cross(v1,v2)), dot(v1,v2));
end
plot(t,discrepancy/(2*pi)*24*60)
hold on
end
set(gca,XLim=pi*[1 1.5], ...
XTick=pi*[1 1.25 1.5], ...
XTickLabels={"Solstice","Cross-Quarter Day","Equinox"})
ylabel('Discrepancy (minutes)');
title('Time Discrepancy');
grid on
legend({'\epsilon = 13.4 deg','\epsilon = 23.4 deg','\epsilon = 33.4 deg'})
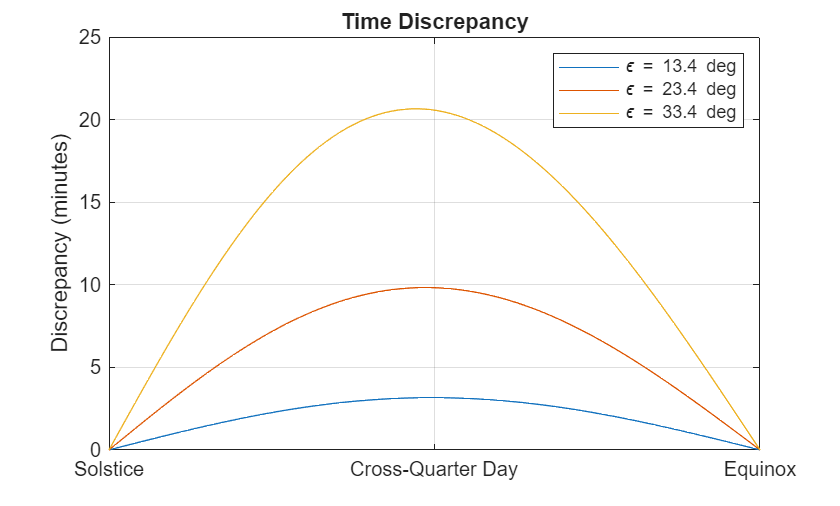
What's going on here? One hour is NOT 1/24 of the time between successive noons. If it was, we'd go insane. To keep from having an hour that is constantly changing, humans created an invariant average "standard hour". The obliquity effect stretches and shrinks the solar day as measured by this standard hour. This moves the local solar noon around, depending on the time of year. And one effect of this is that the earliest sunset arrives sooner than the shortest day. And in fact, the earliest sunset at my latitude is December 9th.


Comments
To leave a comment, please click here to sign in to your MathWorks Account or create a new one.