
MEX Debugging. Redefined.
Folks, today I'd like to introduce a new guest blogger Martijn Aben. Martijn is a support engineer out of our Netherlands office who daydreams about MATLAB's connections to the external world. As part of that he as a great story to tell about how he has integrated with Microsoft's applauded VS Code IDE. Take it away Martijn!
As a MathWorks Technical Support Engineer specializing, among other things, in the MATLAB "external interfaces" areas, I regularly work with MATLAB users having some difficulties with their custom written MEX-files. Sometimes the MEX-files do not produce the expected result, and sometimes they completely crash MATLAB. This can happen because MEX-files are native libraries which can manipulate the native memory inside MATLAB and even the smallest memory corruption can easily lead to a whole application crashing. While we can’t debug your MEX-file source code for you, this is not part of the support which we offer, we can help you with strategies to debug your code yourself. We can provide some hints and tips on what kind of issues to look out for, we can answer questions on the mxArray- and MEX APIs, and we can help you choose and setup your debug environment, which is what I’d like to talk about in this post.
Choosing your debug environment on Windows has historically been pretty simple. We supported the Microsoft Visual C++ compilers for creating MEX-files and if you used that compiler, Microsoft Visual Studio was the obvious choice for a debugger. In fact, getting started with this debugger is part of the actual in-product documentation.
However, in MATLAB R2015b we started to support the MinGW64 compiler which leverages the
Visual Studio Code
When I first tried Visual Studio Code it was still the preview build. It looked like a nice and sleek code editor but I did not immediately recognize how powerful it can be when extensions are added. I recently rediscovered the tool and its extensibility when doing a little hobby IoT project, which showed me how powerful VS Code really has become. As a MathWorks employee and overall MATLAB fan, I then decided to see whether I could use it for debugging MEX-files as well.
Now before we get to the actual setup and debugging, first a few things you need to know about VS Code. In particular, users of the full-fledged Visual Studio may be wondering how to create a Solution and add Projects to it since these do not exist in VS Code, at least not under those names. To create something similar to a Project you essentially Open a Folder and then organize things together in that Folder. Want to open additional projects next to the one you already have open? Add another Folder to your Workspace. Want to create something similar to a Solution with multiple Projects? Open multiple Folders in your Workspace, then Save this Workspace. Opening a solution has then become opening a workspace.
Another important thing to note is that out-of-the-box VS Code is a powerful code editor for many languages but really only a debugger for Javascript and Typescript running in Node.js. For other languages and runtimes you will need to install the relevant extension(s). Since MATLAB MEX-files are written in C/C++ this means we will need an extension, and that extension is aptly named "C/C++". So let's get started by actually installing this extension. Fire up VS Code and head over to the Extensions section in VS Code:

Find the C/C++ Extension:

And install it using that little green
MEX-File Debugging in VS Code
Now that we have a VS Code installation which can debug C/C++ code, let's see how we can configure it for the specific task of debugging MEX-files. We go to the  section of VS Code and then use

First thing we notice is the
{
    "configurations": [
        {
            "name": "Win32",
            "includePath": [
                "c:/ProgramData/MATLAB/SupportPackages/R2018a/3P.instrset/mingw_w64.instrset/x86_64-w64-mingw32/include",
                "c:/MATLAB/R2018a/extern/include",
                "${workspaceRoot}"
            ],
            "defines": [
                "_DEBUG",
                "UNICODE",
                "_UNICODE"
            ],
            "intelliSenseMode": "msvc-x64",
            "browse": {
                "path": [
                    "c:/ProgramData/MATLAB/SupportPackages/R2018a/3P.instrset/mingw_w64.instrset/x86_64-w64-mingw32/include",
                    "c:/MATLAB/R2018a/extern/include",
                    "${workspaceRoot}"
                ],
                "limitSymbolsToIncludedHeaders": true,
                "databaseFilename": ""
            }
        }
    ],
    "version": 3
}
In which we tell VS Code where to find the MinGW64 headers as well as where to find the MATLAB headers. My MATLAB R2018a, which I am working with here, is installed in
With VS Code all happy now, let's add a Debug configuration. We go to go to

This will create a new

VS Code then automatically adds a new section to
{
    "name": "(gdb) Attach",
    "type": "cppdbg",
    "request": "attach",
    "program": "enter program name, for example ${workspaceRoot}/a.exe",
    "processId": "${command:pickProcess}",
    "MIMode": "gdb",
    "miDebuggerPath": "/path/to/gdb"
}
We need to update the
{
    "name": "(gdb) Attach",
    "type": "cppdbg",
    "request": "attach",
    "program": "c:/MATLAB/R2018a/bin/win64/MATLAB.exe",
    "processId": "${command:pickProcess}",
    "MIMode": "gdb",
    "setupCommands": [
        {
            "text": "handle SIGSEGV nostop"
        },
        {
             "text": "handle SIGSEGV noprint"
        }
    ],
    "miDebuggerPath": "c:/ProgramData/MATLAB/SupportPackages/R2018a/3P.instrset/mingw_w64.instrset/bin/gdb.exe"
}
From there I usually delete the
Actual Debugging
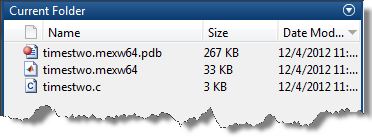
If you paid closed attention in the screenshots above, you could see that I had already compiled
mex -g mymex.c
Where the
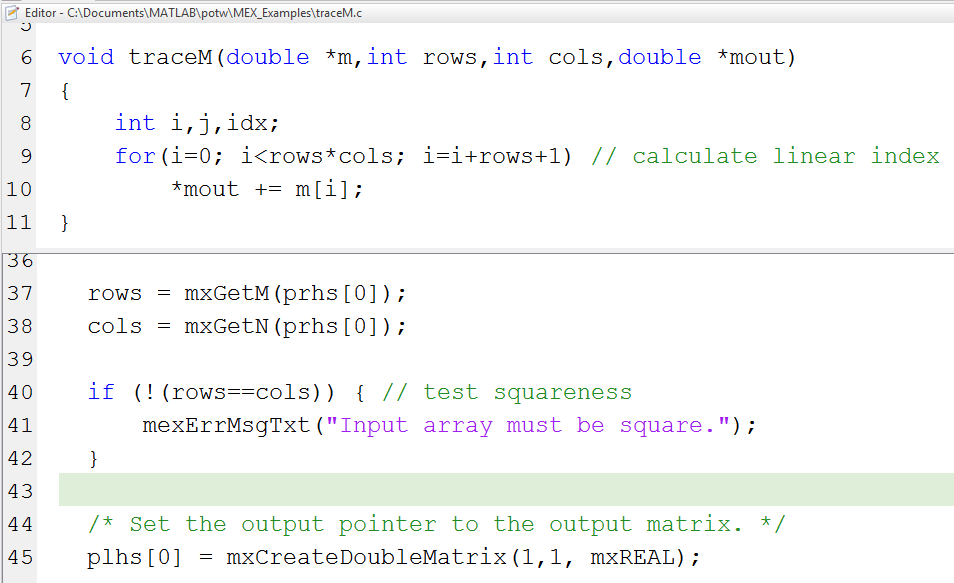
So really all we need to do now is place a breakpoint somewhere in the code:

Switch to the debug view 
Make sure MATLAB is actually running (we configured VS Code to attach the debugger to an already running MATLAB after all) and we then hit the play button:

Which shows a dialog with running processes where we then choose MATLAB:

VS Code should now be attached to MATLAB and we should see some lines like
[New Thread 18404.0x473c]
[New Thread 18404.0x3294]
in the
mymex([1 2 pi 21])
When we do that we will see VS Code will stop on our breakpoint, stepping (F10) a few lines we can then see:

1. We were able to successfully obtain a pointer to the native input data and the first element had value 1
2. The size of the input was indeed a 1x4 vector.
We can also step through our

1. How
2. Inspect certain elements in our array in the
To find out what else you can do, read the Debugging Documentation of VS Code.
Conclusion
I realize we did not actually debug and fix any bugs in any super advanced real-world MEX-files here today, but I did show you how you can get started on debugging MEX-files using one of my recent-favorite free development tools and I hope this has inspired you to give this workflow a try if you ever need to debug one of your MinGW64 MEX-files. Happy hunting for those bugs!
Oh, and for you Linux users out there, while the story above is about MinGW64 and Windows, since VS Code is available for Linux as well, you can also apply this workflow on Linux to debug your GCC MEX-files. Obviously some of the paths will be somewhat different, but I am sure you can figure it out; let us know though if you have any further questions on that.
Footnote
While configuring VS Code we needed the location of the MinGW64 include directory as well as the location of the
- Category:
- MEX,
- Third Party Integration


Comments
To leave a comment, please click here to sign in to your MathWorks Account or create a new one.