
R2024a release: What’s new in Graphics and App Building?
There are dozens of new graphics and app building features in the MATLAB R2024a release. Here are some highlights to keep you in the know! Let us know which topics you’d like to learn more about and stay tuned for deep dives into some of these features.
Top picks
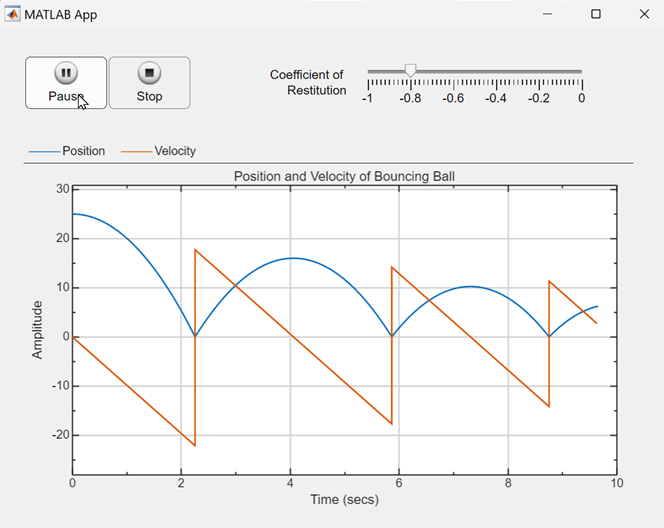
App Designer integration with Simulink
Looking to bridge the gap between Simulink and App Designer? Use App Designer to interactively create an app that controls Simulink simulations, tunes parameters, and visualizes simulation results! Get started
Related articles:
Four new tools for polar plots
Highlight an annulus (radiusregion), wedge (thetaregion), or bounded region (polarregion) in polar axes or plot a polar function (fpolarplot) or symbolic expression (fpolarplot-sym) in polar coordinates.

Working with color and transparency
Apply transparency to a legend (legend BackgroudAlpha) or rectangle (rectangle FaceAlpha), create a color picker component for interactive color selection (uicolorpicker), and convert between RGB vectors and hexadecimal strings color formats (rgb2hex, hex2rgb).
Related articles:


Greater flexibility of app component configuration
In App Designer, convert an app component such as a list box to another type of component such as a drop-down or discrete knob while preserving relevant properties! Right-click the component and select “Replace With”. Support has been extended to push button ⇔ state button, tree ⇔ check box tree, and list box ⇔ drop-down ⇔ discrete knob.

Control the step interval in a RangeSlider component (RangeSlider step).

You spoke, we listened
- You can now control whether ConstantLines (xline, yline) and ConstantRegions (xregion, yregion) appear in the top or bottom layer of an axes (Layer property)
- Now it’s even easier to set a series of line styles and control how they combine with color order (linestyleorder)
- Maybe the year in a datetime ruler doesn’t matter – specify the format for the secondary label on a datetime axis (DatetimeRuler SecondaryLabelFormat)
- Use your keyboard to pan (panInteraction), zoom (zoomInteraction), and rotate (rotateInteraction) axes – create a uifigure, press Tab to put the axes in focus, use the arrow keys to pan or rotate, +/- keys to zoom.
See the release notes for an extended list of features.
Download MATLAB R2024a
- Category:
- App Building,
- Charts,
- Graphics,
- New Features


Comments
To leave a comment, please click here to sign in to your MathWorks Account or create a new one.