
Introducing Transparency to Legends and Rectangles
 |
Guest Writer: Afiq Azaibi Today's R2024a feature highlight is written by Afiq Azaibi, a developer on the Charting Team and a returning contributor to the Graphics and App Building blog. See Afiq's bio on our contributors page.
|

Sometimes a legend or rectangle can occlude data behind it. You can make both objects fully transparent by setting the legend's Box property to 'off' or setting the rectangle's FaceColor property to 'none' respectively but this could be undesirable in some situations. Starting in R2024a, we introduced features to control the transparency of both legends and rectangles. Let's take a look at an example using weather data around the MathWorks HQ located in Natick, MA from ncei.noaa.gov (download link).
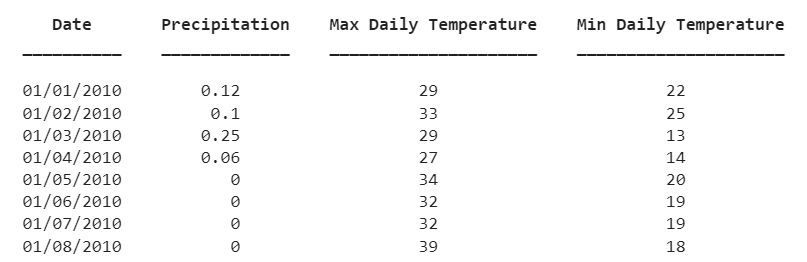
load natickWeatherTbl.mat
head(natickWeatherTbl)
s = scatter(natickWeatherTbl,"Date", ["Min Daily Temperature" "Max Daily Temperature" ],'filled', 'MarkerFaceAlpha',.2);
axis tight;
leg = legend;
title("Daily Temperature in Natick");
ylabel("Degrees (F)");
![]()
The legend is obscuring part of the scatter charts. Starting in R2024a, we can update the BackgroundAlpha property which makes the legend semi-transparent. Now we can see data points behind the legend. If you find yourself in a situation where you can't set the legend's location to be outside and all the locations inside would obscure data, consider leveraging the legend's BackgroundAlpha property.
leg.BackgroundAlpha = .6;
![]()
Additionally, if we wanted to highlight the most number of days below 0 during the winter of 2011, we could add a rectangle in this region. The filled rectangle unfortunately obscures the data.
x = days(natickWeatherTbl.Date(335)-natickWeatherTbl.Date(1));
rect = rectangle('Position',[x,-5.5,100,10], 'EdgeColor', 'none', 'FaceColor', 'c');
![]()
Starting in R2024a, rectangle has a FaceAlpha property which can be used to change the rectangle's transparency.
rect.FaceAlpha = .4;
![]()
Previously the only workaround for this would be to update the child order of the axes such that the scatter markers render on top of the rectangle. Now that rectangle has FaceAlpha, you can choose between the two options depending on whether you want the rectangle to overlay the data or not.
Read more about the R2024a graphics and app building features.
- Category:
- Charts,
- Demos,
- Graphics,
- New Features


Comments
To leave a comment, please click here to sign in to your MathWorks Account or create a new one.