 Cleve’s Corner: Cleve Moler on Mathematics and Computing
 The MATLAB Blog
 Guy on Simulink
 MATLAB Community
 Artificial Intelligence
 Developer Zone
 Stuart’s MATLAB Videos
 Behind the Headlines
 File Exchange Pick of the Week
 Hans on IoT
 Student Lounge
 MATLAB ユーザーコミュニティー
 Startups, Accelerators, & Entrepreneurs
 Autonomous Systems
 Quantitative Finance
 MATLAB Graphics and App Building
Welcome. Can you stay for tea?
Welcome to our new blog. My name is Mike Garrity, and I work in the group which develops MATLAB's graphics system. In R2014b, we've released a new version which we've been working on for a while now. As part of the launch of that new version, we're starting this blog to show you around the new graphics system. I hope that you'll find some useful ideas here about new things that you can create using MATLAB graphics. You'll also find some trivia and other things which are more fun than useful.
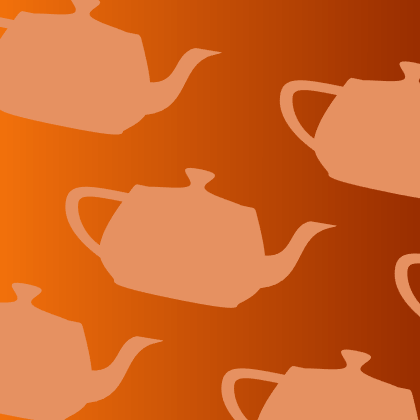
For example, you might be wondering about the teapots behind me in that picture at the top of the blog. Those are an important part of computer graphics history. This teapot was first digitized by Martin Newell back in 1975.
Since then it has become sort of a mascot of computer graphics programmers everywhere. It's usually one of the first things we draw when we're learning a new graphics system. In fact, if you run teapotdemo in MATLAB, you'll find the first code I wrote when I started working on MATLAB. Cleve showed me how to use kron to evaluate the 2D Bezier patches efficiently.
That background image was actually drawn by one of our designers, but let's see how close we can come to recreating it using MATLAB graphics.
First we need that background gradient. We can do that by creating a colormap with the right colors and creating a patch object which interpolates through the colormap.
fig = figure;
fig.Position = [100 100 420 420];

ax = axes;
ax.Position = [0 0 1 1];
ax.Visible = 'off';
ax.SortMethod = 'childorder';
ax.XLim = [0 1];
ax.YLim = [0 1];

nc = 64;
r = linspace(.945,.602,nc);
g = linspace(.438,.180,nc);
b = linspace(.043,.000,nc);
colormap(ax,[r', g', b']);

background = patch([0 1 1 0],[0 0 1 1],[0 1 1 0]);
background.EdgeColor = 'none';

Next we need some teapots! To do that, edit teapotdemo.
edit teapotdemo
Copy all of the code from the start of the function named teapot to the end of the file. Paste that into a new file and save it as teapot.m. Now you have a function that you can call to create your own teapot. Try calling it with different options. We'll come back and talk about the math behind Bezier patches in a future post.
Now that we have a function that creates teapots, we can use it to create a grid of teapots like this:
xfms = gobjects(3,2);
for r = 1:3
    for c = 1:2
        xfms(r,c) = hgtransform('Matrix',makehgtform('scale',.1));
        p = patch('Parent',xfms(r,c));
        teapot(16,'none',0,true,p);
        p.FaceColor = [.902, .570, .379];
        p.EdgeColor = 'none';
    end
end

Notice that each teapot is parented to a hgtransform object. That allows us to move them into the correct positions, like this:
mat1 = makehgtform('xrotate',-pi/2,'yrotate',.2,'scale',.1);
startoffset = [-8 0 -3.35];
for r = 1:3
    for c = 1:2
        offset = startoffset + c*[8 0 0] + r*[0 0 3.5];
        if ~bitand(r,1)
            offset = offset + [3.5 0 0];
        end
        xfms(r,c).Matrix = mat1 * makehgtform('translate',offset);
    end
end
There's a lot going on here.
If you've used MATLAB graphics in earlier versions, then you might be surprised by the way in which it sets properties on graphics objects using 'dot notation'. That's a new style which is possible in R2014b. We'll be using new features like this here in the graphics blog because it makes the code easier to read. It is often possible to port these examples back to earlier versions of MATLAB, but I'll usually be assuming that you're using R2014b.
You might notice some other interesting things in that code. We'll be exploring some of these in future posts, but for today, we'll just close by taking our teapots for a spin.
!teapot_animation.gif
- Category:
- Geometry

