
Capturing the image of this black hole required an Earth-sized telescope
The Milky Way is a hazy, dare I say milky, band of light seen in the night sky. In 1610, Galileo Galilei used his telescope to show the light emanated from individual stars. In 1920, scientists first argued that the Milky Way does not contain all the stars in the Universe but is instead just one of many galaxies. Fast forward to last week, and humans saw the black hole at the center of our galaxy for the first time, thanks to advancements in science and technology and the global collaboration of researchers that support the Event Horizon Telescope (EHT).
According to Phys.org, “On Thursday, an international team of astronomers gave us the first glimpse of the supermassive black hole at the center of the Milky Way. Dubbed Sagittarius A* the gravity- and light-sucking monster some 26,000 light-years from Earth has the same mass as four million Suns.”
Per the EHT website, “Although we cannot see the black hole itself, because it is completely dark, glowing gas around it reveals a telltale signature: a dark central region (called a “shadow”) surrounded by a bright ring-like structure. The new view captures light bent by the powerful gravity of the black hole, which is four million times more massive than our Sun.”
Considering that the black hole is 27,000 light-years away from Earth, how did the scientists from EHT capture the image? The answer to that question lies in how the EHT collects data and how the scientists created an algorithm to turn the massive amount of data into the image shared last week. The result is the first-ever visual evidence of the massive object at the center of the Milky Way.
PBS shared, “The image is the first visual evidence of Sgr A*’s existence; the black hole was previously only indirectly confirmed by observations of stars in orbit around it.”
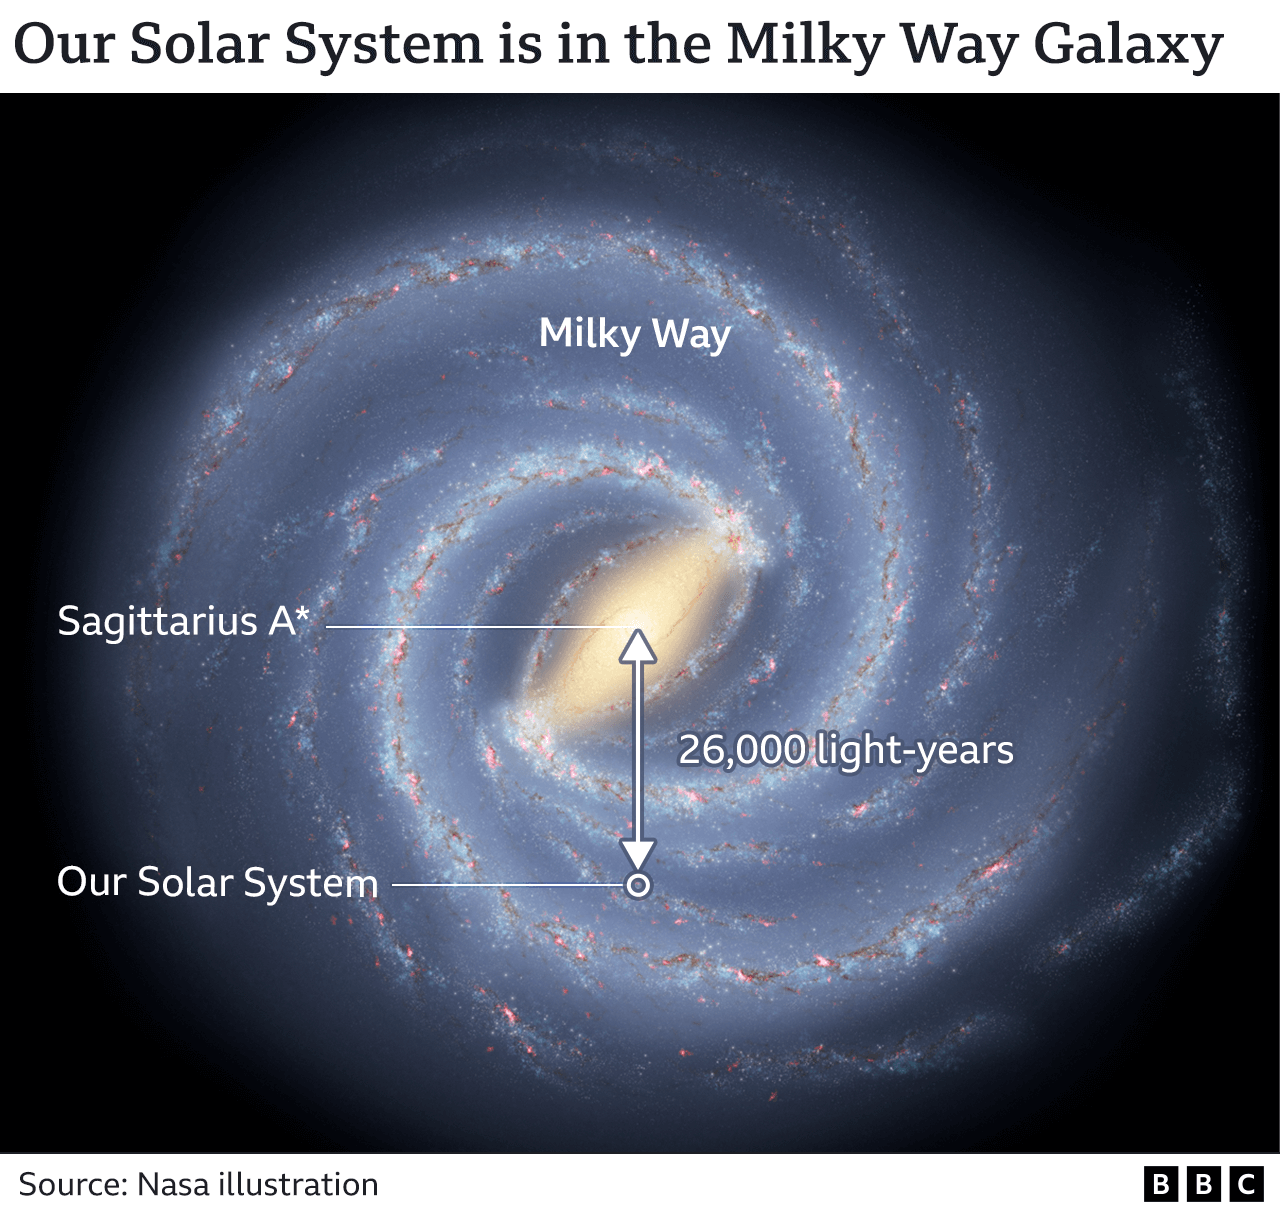
Image credit: NASA via BBC
“Until now, we didn’t have the direct picture to prove that this gentle giant in the center of our galaxy is a black hole,” Feryal Özel, an astrophysicist at the University of Arizona, said during a National Science Foundation news conference held on May 12. “It shows a bright ring surrounding the darkness, and the telltale sign of the shadow of the black hole.”
The flashes of light captured in the image are produced when matter, such as planets or debris, is pulled into the black hole’s outer boundary. This boundary is called an event horizon.
A telescope the size of Earth
In a great analogy, the EHT team explains that given the distance from Earth, seeing the black hole in the sky is like spotting a donut on the moon’s surface. EHT uses very-long-baseline interferometry to create the image, with telescopes spread across our globe, effectively turning our planet into an Earth-sized telescope to capture a tremendous amount of data. EHT then reassembles the terabytes into the image with an algorithm called CHIRP (Continuous High-resolution Image Reconstruction using Patch priors. )
The measurements taken to construct the image of the black hole came from seven radio telescopes spread around the world that comprise the EHT. An eighth telescope at the South Pole aided in calibrating these measurements. Each telescope can see a small part of the black hole, and together, they form a virtual telescope the size of the world that effectively works together like one giant dish.

EHT map. Image credit: D. Marrone/UofA
The observations were performed at a wavelength of 1.3 millimeters, which is 2000 to 3000 times longer than the wavelength of visual light.
Seth Fletcher, Chief Features Editor for Scientific American, described the process: “There’s only a very limited period of time each year when telescopes in Europe, North America, South America, Antarctica can all see the same things in the sky. So they put together [an] elaborate schedule of when Sagittarius A*, for example, is gonna be up over the horizon and visible to what telescopes.
“They just scan black holes for several nights. Then they take all the data in hard drives. Then they physically ship it to two super computer banks, one in Massachusetts, one in Germany, and then they correlate it all into a single data set. And then they search it for common detections where all of its telescopes have seen the same thing.”
Instrumenting the telescopes to work together
In order to stitch together the data, the EHT teams need to ensure the high bandwidth data is collected in the same way at each telescope.
To ensure consistent data collection, each telescope requires the same high-performance instrumentation. The EHT based its instrumentation on digital hardware and technology developed by the Collaboration for Astronomy Signal Processing and Electronics Research (CASPER).
CASPER designs and ships FPGAs boards to each telescope site to ensure the telescopes are processing the observed radio waves in the same way. These FPGAs were designed with Simulink. The end-users at each site utilize a highly-efficient polyphase filter bank for signal processing. A polyphase filter bank is similar to a fast Fourier transform (FFT), but with improved channel isolation. The FPGAs offer higher throughput and better energy efficiency than a typical CPU or GPU.
“Simulink was crucial in producing the M87 and recent image of the black hole at the center of the galaxy,” says Dan Werthimer, chief scientist at the Berkeley SETI Research Center. “The Casper FPGA instrumentation ran at all the radio telescopes and collected several petabytes of data used to make these images. Simulink was also used to design and test the beamformer instruments that combined signals from all the antennas in both Chile and Hawaii sites for these images.”
The image exceeded expectations
Per the EHT blog, the image has advanced our understanding of our own galaxy. “We were stunned by how well the size of the ring agreed with predictions from Einstein’s Theory of General Relativity,” said EHT Project Scientist Geoffrey Bower from the Institute of Astronomy and Astrophysics, Academia Sinica, Taipei. “These unprecedented observations have greatly improved our understanding of what happens at the very centre of our galaxy, and offer new insights on how these giant black holes interact with their surroundings.”
The EHT team’s results are being published today in a special issue of The Astrophysical Journal Letters.
EHT image of the black hole, Sagittarius A*. The inset images represent different imaging solutions and their associated frequency (histograms). Image credit: The Astrophysical Journal Letters.


コメント
コメントを残すには、ここ をクリックして MathWorks アカウントにサインインするか新しい MathWorks アカウントを作成します。