Determining point positions in MRI peg phantom
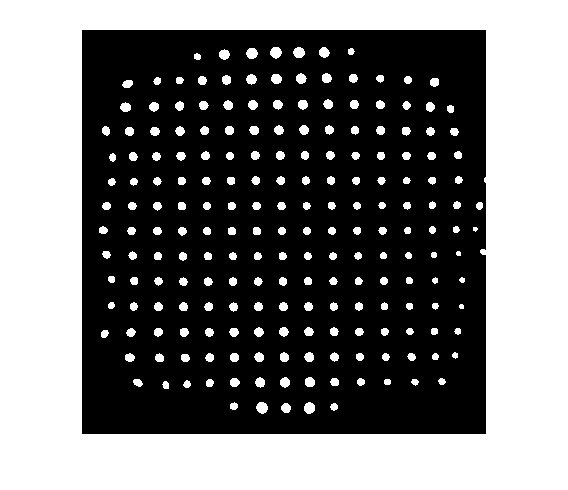
Blog reader Jonathan from St. Jude Children's Research Hospital sent me an image derived from an MRI peg phantom:
bw = imread('https://blogs.mathworks.com/images/steve/62/mri_peg_phantom.png');
imshow(bw)
Jonathan wanted to know how to determine the position of each point. The functions bwlabel andregionprops do the trick.
The function bwlabel takes a binary image and figures which groups of white pixels are connected to each other.
L = bwlabel(bw);
The output L is called a label matrix. It has the same size as bw and contains nonnegative integers. Each positive integer value corresponds to a particular object. For example, to display the 10th object, just compare L to 10:
imshow(L == 10)

The function regionprops computes a number of different geometric properties of all the different regions contained in a label matrix. All we need for this application is the centroid:
s = regionprops(L, 'Centroid')
s =

205x1 struct array with fields:
    Centroid
The size of the structure array s tells you the number of labeled objects: 205. The centroid of the 10th object is:
centroid_10 = s(10).Centroid
centroid_10 =

   44.1687   77.8072
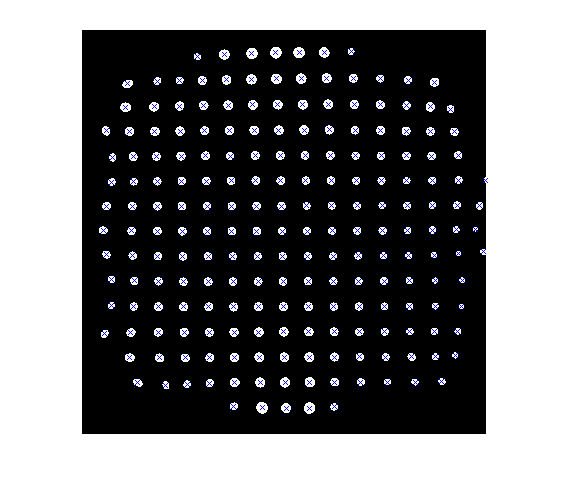
Here's a simple way to superimpose the centroid locations onto the original image:
imshow(bw)
hold on
for k = 1:numel(s)
    plot(s(k).Centroid(1), s(k).Centroid(2), 'x')
end
hold off

Thanks for letting me show this image in the blog, Jonathan.


댓글
댓글을 남기려면 링크 를 클릭하여 MathWorks 계정에 로그인하거나 계정을 새로 만드십시오.