Visualizing the output of bwlabel
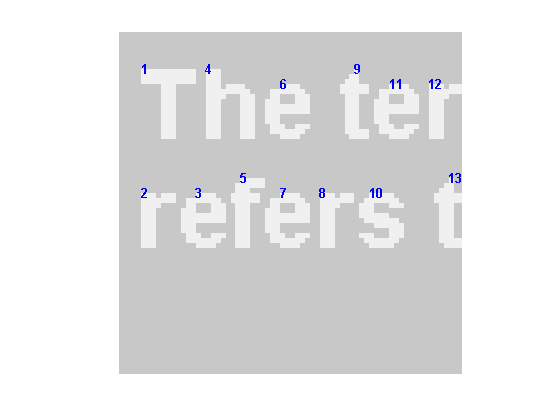
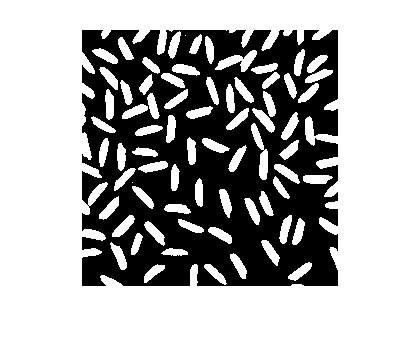
I often find myself writing small functions that help visualize certain image processing algorithms. For example, my last three posts on bwlabel included identical snippets of code that performed the following steps on a label matrix:
1. Display a binary image using two light shades of gray.
2. Use regionprops to find the location of each labeled object.
3. Superimpose object text labels over each labeled object.
The visualization code, although not complicated, was longer than the algorithm code I was trying to explain. That can obscure the key points of the discussion. It would be nice if there were a single visualization function to call.
In the past, we haven't put algorithm visualization functions into the Image Processing Toolbox. They don't really increase what you can do with the toolbox, and there are many different visualization techniques that might be useful for any given algorithm. Even within a single basic technique, such as my bwlabel visualization, there are many possible variations.
Still, algorithm visualizations can be very useful. We've been talking recently about including "example" visualizations in the toolbox. My idea is that each example visualization should have simple code and a simple syntax. We shouldn't succumb to the temptation to overdesign these examples by supporting lots of options and variations, or by overoptimizing them. The primary purpose of the examples would be to provide inspiration and a starting point for our users to create their own visualizations.
This week I captured the visualization code from my recent posts into a function called VISLABELS, which I uploaded to the MATLAB Central File Exchange. Here's how to use it:
help vislabels VISLABELS Visualize labels of connected components
VISLABELS is used to visualize the output of BWLABEL.
VISLABELS(L), where L is a label matrix returned by BWLABEL,
displays each object's label number on top of the object itself.
Note: VISLABELS requires the Image Processing Toolbox.
Example
-------
bw = imread('text.png');
L = bwlabel(bw);
vislabels(L)
axis([1 70 1 70])
And here's what the example does:
bw = imread('text.png');
L = bwlabel(bw);
vislabels(L)
axis([1 70 1 70])
Do you have your own favorite ways of visualizing algorithms? I encourage you to share them on the File Exchange.
- Category:
- Connected components


Comments
To leave a comment, please click here to sign in to your MathWorks Account or create a new one.