R2010b – Image Processing Toolbox performance improvements
MathWorks shipped release R2010b last month. Today I want to mention several performance improvements made in the Image Processing Toolbox.
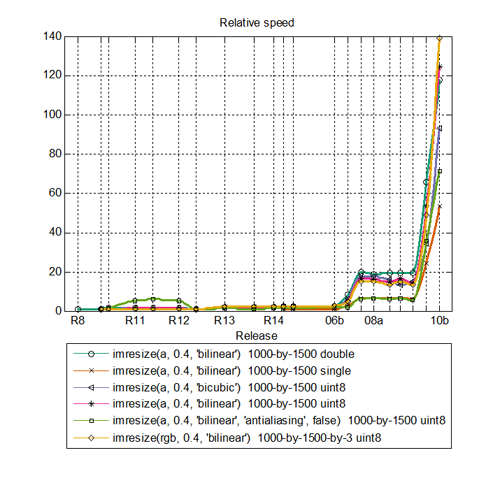
First, imresize received more love and attention in this release. Several benchmark imresize problems are plotted together below. The y-axis is "relative speed." That means that each line on the plot is normalized by the slowest recorded speed for the corresponding benchmark. MATLAB releases are plotted on the x-axis. R8 on the left is MATLAB 5 back in early 1997. "10b" on the right is short for R2010b.
All of the benchmark curves have gone up several times in the last few years. If you look closely you can see that speed improvements were made in R2007a, R2007b, R2010a, and again in the just-released R2010b.
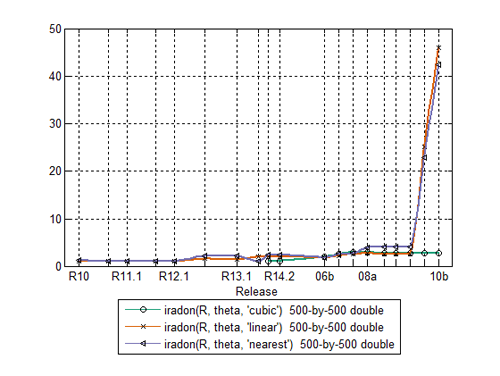
The function iradon has also been improved in both the last two releases, at least for the 'linear' and 'nearest' interpolation options.
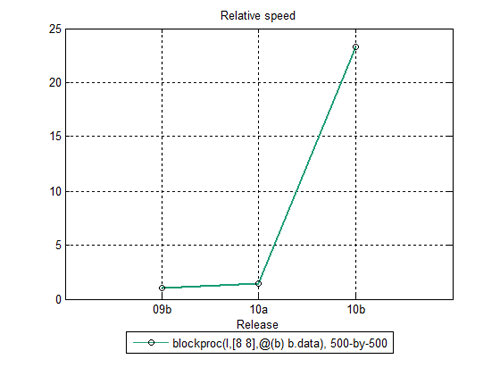
Finally, the relatively new function blockproc had a fairly high amount of overhead in it when it was first released. That overhead has now been optimized away. The benchmark problem, shown in the plot's legend below, just leaves each block unchanged. That way we are only measuring the speed of blockproc and not the speed of the user-defined function applied by blockproc.
I will discuss other aspects of R2010b soon. I'll focus on things that particularly interest me. Be sure to check out the other MATLAB Central bloggers to see what they have to say about the release.




Comments
To leave a comment, please click here to sign in to your MathWorks Account or create a new one.