
Advanced maneuvers with regionprops
Blog reader Mutlu recently asked me this question:
"I have two images - one contains class labels (one of 1 or 2) and one containing image segment (region) unique IDs. I am trying to use regionprops (or something like regionprops) to figure out most frequently occurring label from the label image per region and generate a new image where each unique region contains this most frequently occurring label. Is there a way to do this?"
The answer is yes. I thought the techniques might be applicable to different kinds of problems, so I'm posting the description here for everyone.
I don't have a specific example from the Mutlu's own application, so I made up a sample image to illustrate.
url = 'https://blogs.mathworks.com/images/steve/2011/regions-classes-example.png';
bw = imread(url);
imshow(bw)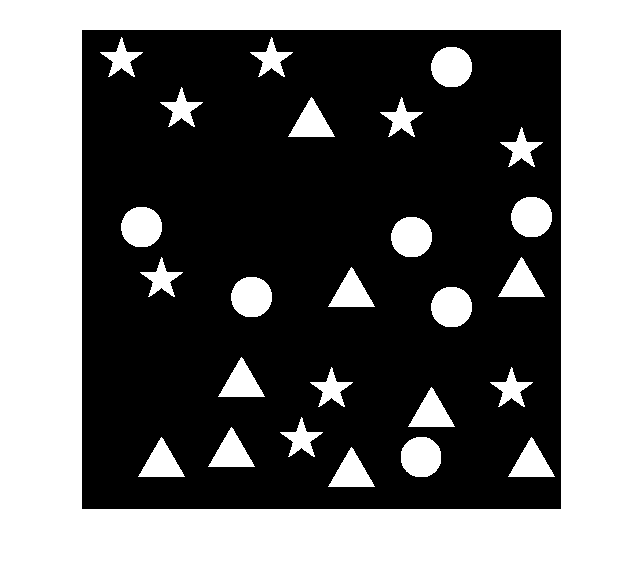
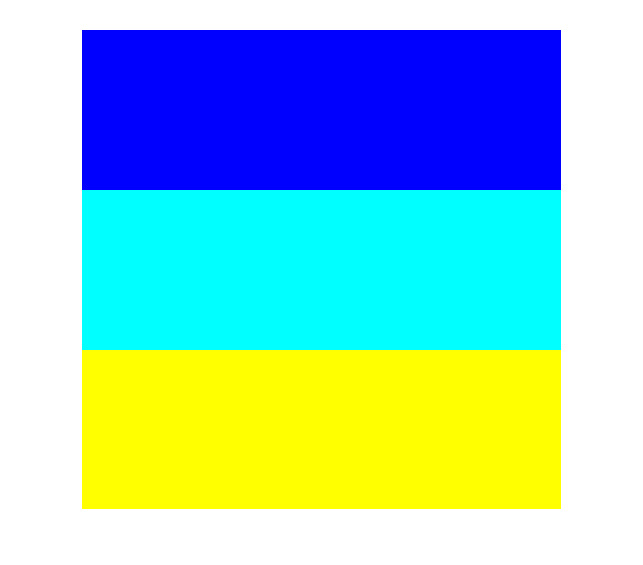
Suppose this image is divided up into three horizontal regions, as defined by this label matrix:
regions_url = 'https://blogs.mathworks.com/images/steve/2011/regions.png';
regions = imread(regions_url);
imshow(label2rgb(regions, 'jet', [.5 .5 .5]))
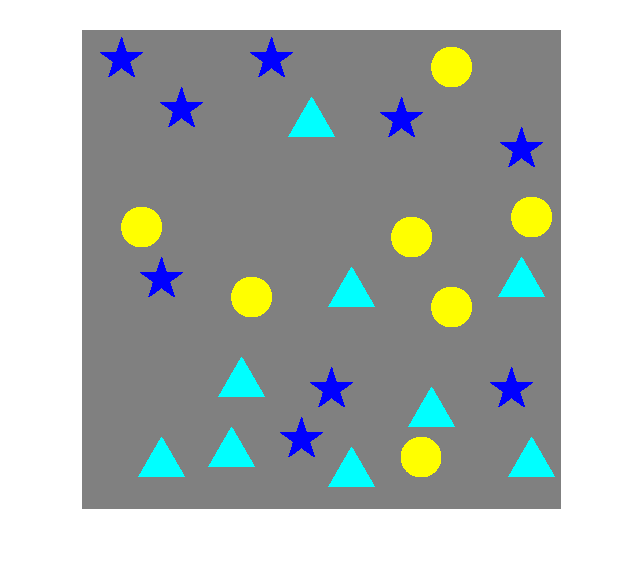
Further, suppose that the shapes in the original image are divided into three classes - the stars, the triangles, and the circles - as defined by this label matrix:
classes_url = 'https://blogs.mathworks.com/images/steve/2011/classes.png';
classes = imread(classes_url);
imshow(label2rgb(classes, 'jet', [.5 .5 .5]))
I can imagine different ways toward the solution. Here's the rough procedure I'm going to follow:
1. Determine the connected components (objects) in the image, including a list of pixel locations for each one.
2. Determine the class of each connected component.
3. Determine the region of each connected component.
4. For each region, determine the mode of the connected component classes contained in that region.
5. Construct the output image containing only the most frequently occurring object classes in each region.
Step 1: Determine the connected components (objects) in the image, including a list of pixel locations for each one. (I'm also going to compute the centroids for each object, but that's only because I'm going to use those for visualization steps along the way.)
cc = bwconncomp(bw);
s = regionprops(cc, 'PixelIdxList', 'Centroid');
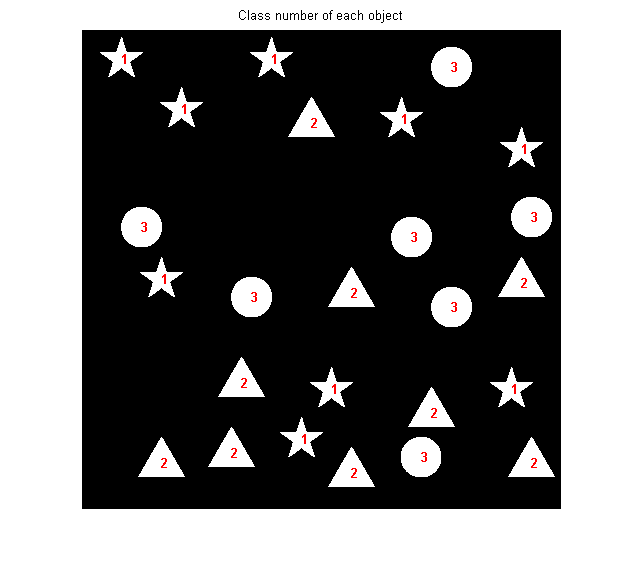
Step 2: Determine the class of each connected component. I'll do this by using the pixel index list for each connected component to index into the classes label matrix. I'll tack on the class number to the existing structure array returned by regionprops; this is a pretty useful technique to remember.
for k = 1:cc.NumObjects
    s(k).ClassNumber = classes(s(k).PixelIdxList(1));
end
Let's plot the class numbers on top of the original image to make sure we did it right. We should have 1s for the stars, 2s for the triangles, and 3s for the circles.
imshow(bw)
hold on
for k = 1:numel(s)
    x = s(k).Centroid(1);
    y = s(k).Centroid(2);
    text(x, y, sprintf('%d', s(k).ClassNumber), 'Color', 'r', ...
        'FontWeight', 'bold');
end
hold off
title('Class number of each object')
Step 3: Determine the region number associated with each connected component. We have to think a little harder about this one, because there's a possibility that a connected component could lie in more than one region. I suggest that we find the region number of every pixel of each connected component and then use the mode function as a tiebreaker for components that lie in multiple regions.
for k = 1:cc.NumObjects
    s(k).RegionNumber = mode(single(regions(s(k).PixelIdxList)));
end
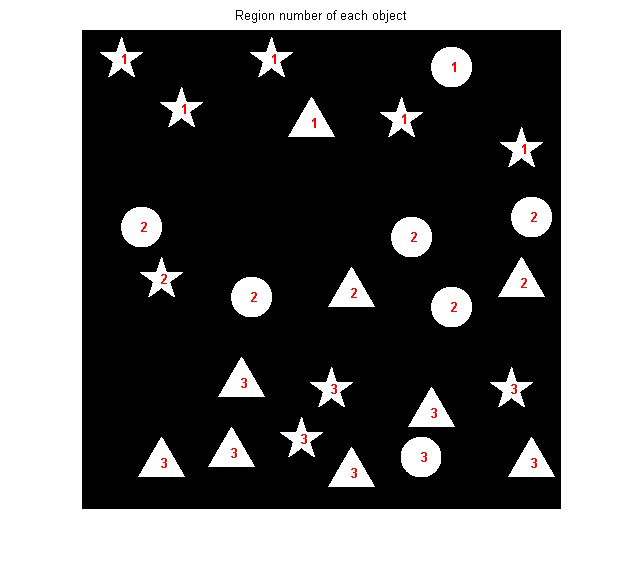
Once again, let's plot the region numbers as a sanity check.
imshow(bw)
hold on
for k = 1:numel(s)
    x = s(k).Centroid(1);
    y = s(k).Centroid(2);
    text(x, y, sprintf('%d', s(k).RegionNumber), 'Color', 'r', ...
        'FontWeight', 'bold');
end
hold off
title('Region number of each object')
Step 4: For each region, determine the most frequently occurring object class in that region. Again, we'll make use of the mode function.
num_regions = max(regions(:));
most_frequent_class = zeros(1, num_regions);
region_vector = [s.RegionNumber];
class_vector = [s.ClassNumber];
for k = 1:num_regions
    most_frequent_class(k) = mode(single(class_vector(region_vector == k)));
end

most_frequent_class
most_frequent_class =

     1     3     2
Step 5: Construct the output image containing only the most frequently occurring object classes in each region.
bw2 = false(size(bw));
for k = 1:numel(s)
    if most_frequent_class(s(k).RegionNumber) == s(k).ClassNumber
        % The class number of this object matches the most frequent class
        % number of objects in this region.
        bw2(s(k).PixelIdxList) = 1;
    end
end

imshow(bw2)
title('Final result')
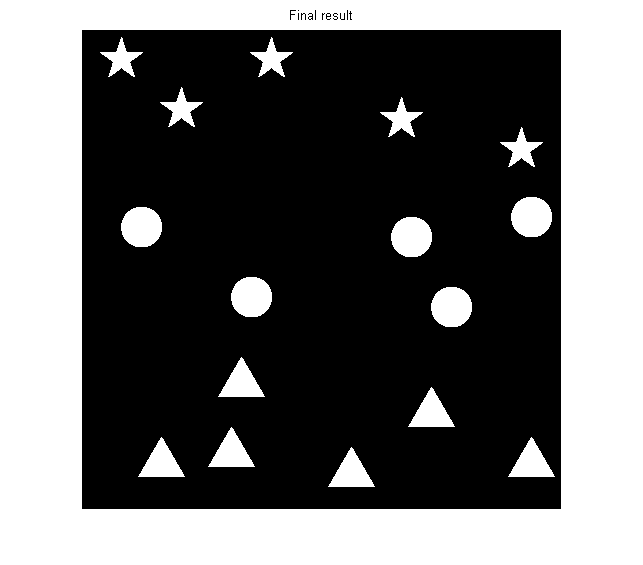
You can see that only stars are in region 1, only circles are in region 2, and only triangles are in region 3.
Here's the complete computation in one block of code:
cc = bwconncomp(bw);
s = regionprops(cc, 'PixelIdxList', 'Centroid');

for k = 1:cc.NumObjects
    s(k).ClassNumber = classes(s(k).PixelIdxList(1));
end

for k = 1:cc.NumObjects
    s(k).RegionNumber = mode(single(regions(s(k).PixelIdxList)));
end

num_regions = max(regions(:));
most_frequent_class = zeros(1, num_regions);
region_vector = [s.RegionNumber];
class_vector = [s.ClassNumber];
for k = 1:num_regions
    most_frequent_class(k) = mode(single(class_vector(region_vector == k)));
end

bw2 = false(size(bw));
for k = 1:numel(s)
    if most_frequent_class(s(k).RegionNumber) == s(k).ClassNumber
        % The class number of this object matches the most frequent class
        % number of objects in this region.
        bw2(s(k).PixelIdxList) = 1;
    end
end
The entire computation takes about 11 ms on my laptop.
There were a lot of useful techniques demonstrated here, especially:


댓글
댓글을 남기려면 링크 를 클릭하여 MathWorks 계정에 로그인하거나 계정을 새로 만드십시오.