
Tiling without a Wet Saw
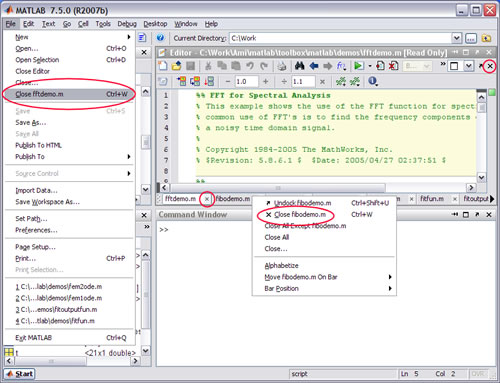
The various desktop tools that contain documents (the Editor, Array Editor, Figures container, etc) display one document at a time by default. Tiling allows you to see more than one document at a time. For example, in the Editor you might want to see two files side-by-side as shown below.

To achieve this, choose “Left/Right Tile” from the Window menu or the Editor toolbar. Alternatively, you can choose “Top/Bottom Tile” to view one file above another. If you have more than two files open, the tiles will be populated with the file that was showing, plus the one that appears after it on the document bar. Once you have create the tiles, you can make any file appear in a particular tile simply by dragging from its document bar button into the tile. Alternatively, you can use the Tile dialog, displayed by choosing Window->Tile… from the menu bar, to select which files should appear in advance.
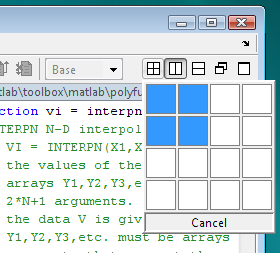
You can tile documents into an arbitrary n x m grid by using the tiling widget depicted below.
It’s not clear why you would want to display more than two text files at a time but if you do, have at it. On the other hand, it’s easy to envision situations where you would like to see more than two MATLAB figures at once. The following shows the result of selecting a 2 x 2 grid when there are three figures open.
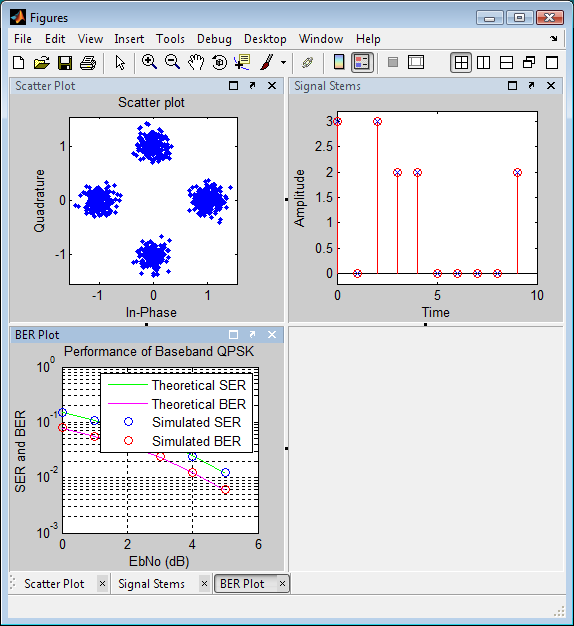
When you specify a new grid, the open figures are dealt into the tiles by row and then column according to their order of appearance on the document bar, starting with the currently selected document. In the above case there was one less figure than the number of tiles so the last tile remained empty. You can tailor the tiling for three documents by removing the divider in the bottom half of the grid. To do this, hover of the small dot at the center of the divider. An [x] button appears. Click the [x] and the bottom tiles will merge into one.
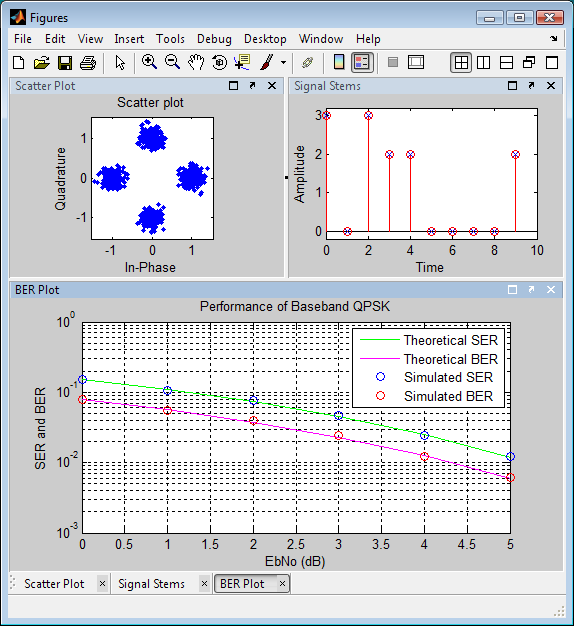
Removing a divider never closes a document. For example, if you remove the divider between the two figures in the upper half of the Figures container depicted above, both figures remain open, one on top of the other. You can also subdivide any tile by right clicking on the title bar of the document it contains (or on the background if it doesn’t contain a document). The right click context menu offers options to subdivide the tile left/right or top/bottom.
You can carry this subdividing and merging business well beyond the point of utility. Witness the following tile arrangement:
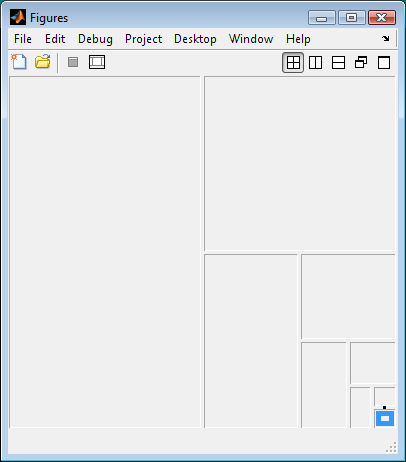
You can even turn it into a bit of a game; How many subdivisions and merges do you need to arrive at this arrangement?

Clearly this post has now gone beyond the limit of utility.
- Category:
- Editor


Comments
To leave a comment, please click here to sign in to your MathWorks Account or create a new one.