Skip to Main Content Skip to Search
File Exchange
MATLAB Newsgroup
Link Exchange
  Blogs  
 Contest 
MathWorks.com

Steve on Image Processing

December 5th, 2006

POLY2MASK and ROIPOLY - Part 1

This is the first of several blogs about the algorithm behind poly2mask and roipoly. poly2mask takes a set of polygon vertices and produces a binary mask image. The binary mask has 1s for pixels inside the polygon and 0s for pixels outside.

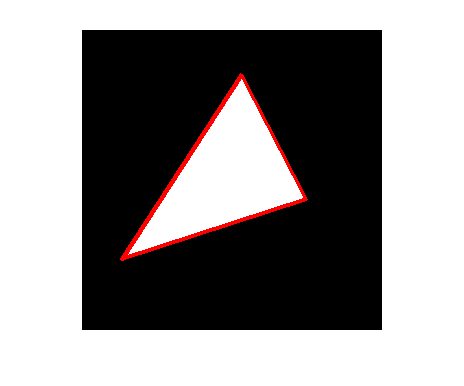
Here's a quick peek at what it does.

x1 = [40 225 160 40];
y1 = [230 170 45 230];
mask = poly2mask(x1, y1, 300, 300);
imshow(mask)
hold on
plot(x1,y1,'LineWidth',3,'Color','r');
hold off

Earlier versions of the Image Processing Toolbox just had roipoly. It contained both the core algorithm as well as a simple GUI for specifying the polygon vertices with mouse clicks. A few releases ago, we separated the core algorithm into its own function, poly2mask. Now roipoly handles image display and grabbing mouse clicks, and it calls poly2mask for the computation.

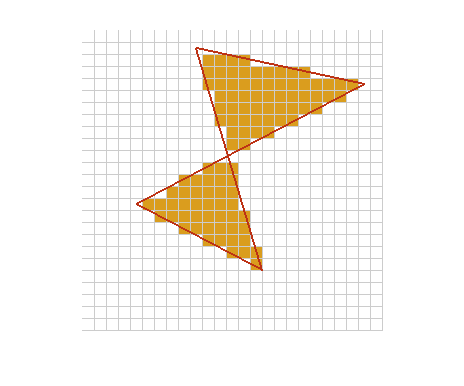
You can see that the computation might be nontrivial if you use a more complicated polygon, and if you zoom in a bit so you can see what's going on along the polygon edges. My second example computes a 25-by-25 mask, displays the mask using high magnification, and displays a gray grid showing the edges of the pixels.

x2 = [10 24 5 15.5 10];
y2 = [2 5 15 20.5 2];
M = 25;
N = 25;

mask = poly2mask(x2,y2,25,25);
map = [255 255 255; 218 157 30] / 255;
imshow(mask,map,'InitialMagnification',1000)

hold on
xx = 0.5:1:N+0.5;
yy = 0.5:1:M+0.5;
for k = 1:numel(xx)
    plot([xx(k) xx(k)], [0.5 M+0.5], 'Color', [.8 .8 .8]);
end

for k = 1:numel(yy)
    plot([0.5 N+0.5], [yy(k) yy(k)], 'Color', [.8 .8 .8]);
end

plot(x2,y2,'LineWidth',2,'Color',[189 50 21]/255);
hold off

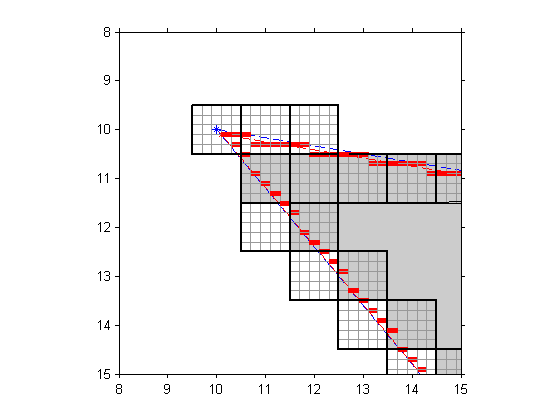
The interesting pixels are those which are only partially inside the polygon. How do we decide the mask value for those pixels?

In the computer graphics space, I believe the most common term for this operation is polygon scan conversion. If you do a Web search on this term you'll find lots of links, many of which go to computer graphics course notes.

My own educational background is in electrical engineering, specializing in digital image and signal processing. When I left academia to become a software developer, implementing image processing algorithms, I found that many things I really needed to know were in the computer graphics literature, not in the image processing literature. (That's why the image processing team has Graphics Gems volumes 1-5 on our bookshelf.) That is most certainly the case for polygon scan conversion.

In my next blogs on this topic, I'll explain the desirable properties that a polygon scan conversion algorithm should have, the special cases that tend to trip up simple implementations, and the details of the Image Processing Toolbox implementation.


Get the MATLAB code

Published with MATLAB® 7.3

10 Responses to “POLY2MASK and ROIPOLY - Part 1”

  1. Sagiv replied on :

    Hi Steve,
    I think there’s a typo in your code.
    In the second example there’re two declarations: x2 and y2
    while the following two lines use x and y instead:
    mask = poly2mask(x,y,25,25);
    plot(x,y,’LineWidth’,2,’Color’,[189 50 21]/255);

    Thanks,
    -Sagiv.

  2. Steve replied on :

    Sagiv - Thanks, I fixed the problem. I didn’t notice it when I published from MATLAB because I happened to have x and y variables in my workspace with the same values.

  3. Andy replied on :

    Dear Steve,

    I have a question smiliar to deciding the mask values along the edge. I hope it’s okay to ask here. How is the motion blur (obtained by fspecial(’motion’,len,theta)) actually defined? I couldn’t find the formula in the Uers’ Guide. Thanks.

    Andy

  4. Steve replied on :

    Andy - The output values are computed as the nearest distance between the element center and the idealized line segment. I couldn’t find this anywhere in the doc, so we’ll make a note to add this information in a future release.

  5. Olivier replied on :

    Dear Steve,

    I am actually looking for an algorithm that does the reverse of this script; a mask2poly so to speak. So, the input is a mask and the output a number of vertices. Would you know if there is any script in Matlab that does this?

    Regards,

    Olivier.

  6. Steve replied on :

    Olivier - look at bwboundaries and bwtraceboundary in the Image Processing Toolbox.

  7. Olivier replied on :

    Steve,

    Thanks for the advice, but I think I need a vertex reduction script now. Any advice on that?

    Thanks again,

    Olivier.

  8. Steve replied on :

    Olivier - I don’t have a polygon vertex reduction function to offer you, but I’ll add it to my list of possible blog topics. Fortunately, for the output of bwboundaries or bwtraceboundary, the vertices all lie on a regular axes-oriented grid, so there are no numerical problems with determining colinearity. I think you might be able to eliminate vertices efficiently in iterations in which you alternate between considering odd-numbered and even-numbered vertices.

  9. Sridharan Kamalakannan replied on :

    Hi Steve,

    I have a polygon which i coverted to a mask by using poly2mask command. Now i have to color the mask by using patch, i.e. i want to superimpose a color mask on an image such that I can adjust the transparency of the mask.

    In short I would like to know if there is some command to fill specific pixels with a color such that its transparency can be adjusted.

  10. Steve replied on :

    Sridharan—Use your polygon vertices to create a patch object that is superimposed over the image. Then you can adjust the transparency of the patch.

Leave a Reply


Steve Eddins manages the Image & Geospatial development team at The MathWorks and coauthored Digital Image Processing Using MATLAB. He writes here about image processing concepts, algorithm implementations, and MATLAB.

  • erik: “The two-dimensional Gaussian is the only radially symmetric function that is also separable” i...
  • huda: Hye.. I’m new to this image processing things.. I was told to make an image segmentation of a picture.....
  • Steve: Collin—There are functions that might be useful for the task. You might want to take a look at roifill.
  • Steve: Lori—Sure, multiple Handle Graphics objects can be combined in one plot. If you want to use imshow to...
  • collin: Hi steve, Could I erase the lines detected from an image. is there any function? thank you!
  • Lori: Is there a way to superimpose a small image onto a larger plot? I’m doing some geographical maps and...
  • Steve: WS—Because they are used twice. Here’s an example: A 1-by-5 flat structuring element can be...
  • WS: What I don’t understand is, why some decomposed structuring elements are listed twice?
  • Steve: Eman—In my completely biased opinion, I think that MATLAB (with the Image Processing Toolbox) is a...
  • Steve: Gene— sum(bw(:)) / numel(bw)

These postings are the author's and don't necessarily represent the opinions of The MathWorks.

Related Topics