Didja know about the Image Processing Toolbox function bwselect?
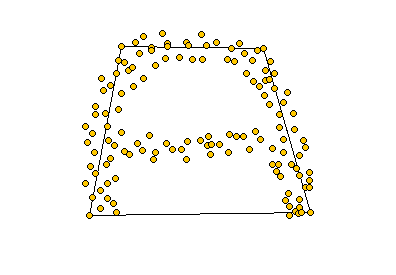
For a blog post I wrote earlier this month, I wanted a binary image containing only the central blob indicated in red below:
url = 'http://blogs.mathworks.com/images/steve/163/plateaus.png'; bw = imread(url); imshow(bw) annotation(gcf,'ellipse','LineWidth',3,... 'Position',[0.4931 0.463 0.07575 0.2029],... 'Color',[0.8471 0.1608 0]);
The Image Processing Toolbox function bwselect is perfect for this task. You can use it interactively or noninteractively.
If you use the interactive syntax:
bw2 = bwselect(bw)
the function displays bw and waits for you to click on the image with the mouse. You can click on one or multiple points. To finish your selection, double-click on the last point, or just press RETURN. bwselect then returns a binary image containing only the objects ("blobs") that you clicked on.
You can also use the noninteractive syntax, in which you pass in the point locations as input arguments instead of using the mouse.
For example:
pond = bwselect(bw, 183, 170); clf imshow(pond)
I hope you find this function useful.
Get
the MATLAB code
Published with MATLAB® 7.5


Is there a similar function catering to colored images..coz jus tried the same set of commands(using the mouse set)but just got an error..am using matlab 6.5
Charon—No. Image Processing Toolbox functions starting with bw are for binary (“black and white”) images.
would be great if u could shed some light on working with colored images ..or some page that would help me out..
still working on focusing the part of the blurred colored image on
http://epsilonminussemimoron.blogspot.com
the code on the site works perfectly with the inbuilt cameraman pic but always runs into some errors wen i use the other pic in jpg format
Charon—The links I sent you by e-mail contain pointers to the Image Processing Toolbox Users Guide. I suggest that you look through the introductory chapters, especially the material on different image types, including color images. If you are not familiar with how multidimensional arrays work in MATLAB, you should also review that part of the Getting Started section of the MATLAB doc.
Thank’s
Bryce
Your comments are OK for a known image but how do we locate an item appearing somewhere on an image. My interest is in locating the coordinates for the H and L in the centre of the moving Highs and Lows in a succession of weather maps. Could you assist, please.
D’Arcy—Sounds like it might be a good candidate for template matching. You might try normalized cross-correlation; see normxcorr2.
Hi, im still a newbie at this. I’m trying to study on identifying color patches from a user glove. just wondering how i’ll be able to select these color patches if they are located differently for every frame. thanks
Clang—You might want to look at the color segmention demo. Click on the “Demos” link, under Image Processing Toolbox on the right side of the page.
I’ve been playing with normxcorr2, specifically the image registration example at http://www.mathworks.com/products/demos/image/cross_correlation/imreg.html.
It says “The image sub_onion will be the template, and must be smaller than the image sub_peppers.”
But when you run the example, the matrix of outputs is huge. How can I make the function only compute the coefficients for the cases where the template fits within the image to which it is being registered.
For example, if I have a 100 X 100 master image and a 90 X 80 subimage, I want only a (100-90)X(100-80) = 10 X 20 matrix of coefficients. How do I tell the function not to pad the edges?
StevenB—The function normxcorr2 doesn’t support that behavior. You’ll have to modify the function yourself.
How do you go about guessing pixels fir the bwselect function. In the above example I downloaded the image and tried fiddling with the numbers and i couldnt see anything.
Utk—You could use the interactive bwselect syntax, which lets you use the mouse to define starting locations, or you could use impixelinfo to display pixel location information on the figure window as you move the mouse around.
Hi Steve. I have just recently started working with the image processing toolbox. At the moment I am trying to write a program that allows a user to select ‘fields’ on images of ordnance survey maps. I have been using bwselect and the mouse to allow the user to click on regions of interest. It would be very useful if I was able to display each selected region as colored after each single mouse click, as opposed to after the double click when all selections have been made. Is there any simple way to do this without creating a more complex GUI, or without creating a loop where the number of selections is known in advance? Alternatively, can you suggest some other suitable method? Thanks – great blog by the way!
Pete—Thanks for the kind words. I can’t think of a way to do what you suggest without getting into some custom GUI programming. See my GUI programming resources page.
Please, if you can help me , how can I use bwselect function, to change the location of the object which we selected, for example,we want to give new coordinates for this object! is it possible?
Tarik—Use find to get the indices of the select object. Set the image elements at those location to zero. Offset the locations by the desired amount, and then set the image elements at the offset locations to be 1.
Hi Steve,
I need to select the biggest object in a b&w picture.So is there a possible way in matlab to realise it without indicate particular pixel values?
Denis—Use regionprops with the ‘Area’ measurement.