Blog reader Ram asked a question last week that I hear fairly often: When you apply a spatial transformation to an image, how can you see the x-y coordinates when you display the image?
The answer has three steps:
1. Ask imtransform for the spatial coordinates of the output image
2. Give imshow the spatial coordinates when you display the output image
3. Turn on the axis box and tick labels
Let's walk through these steps using an affine transformation.
T = maketform('affine',[.5 0 0; .5 1.5 0; 100 200 1]); I = imread('cameraman.tif');
The first output from imtransform is the transformed image. There are two more optional arguments, though: xdata and ydata. xdata is a two-element vector specifying the x-coordinates of the first and last image columns. Similarly, ydata specifies the y-coordinates of the first and last image rows.
[I2, xdata, ydata] = imtransform(I, T); xdata
xdata = 101 356
ydata
ydata = 201.5000 584.5000
Step 2 is to pass the coordinate information to imshow. You can do that by using the 'XData' and 'YData' parameters, like this:
imshow(I2, 'XData', xdata, 'YData', ydata)
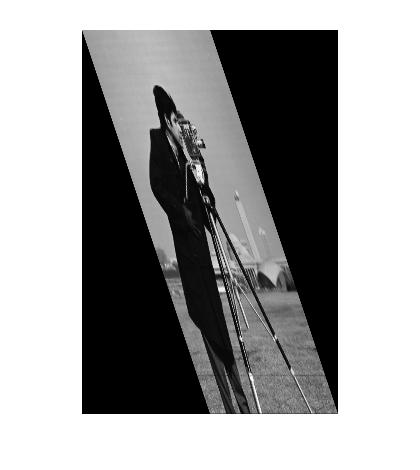
But we still can't see the coordinates! That's because imshow turns the axis display off. That brings us to step 3: Turn on the axis box and tick labels:
axis on
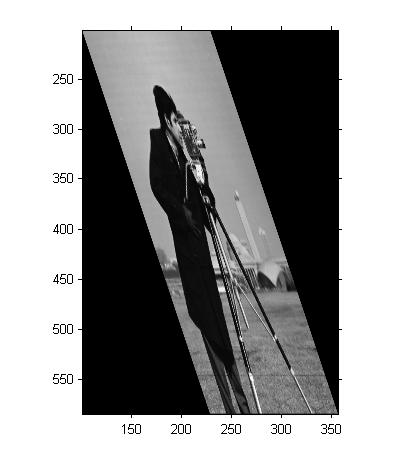
After you do these steps, you might also want to call impixelinfo, which turns on a display of pixel location and value in the figure window. The display updates as you move the mouse.
Get
the MATLAB code
Published with MATLAB® 7.6


Hi Steve,
I would like to do a delaunay triangulation of an irregular volume and then apply a transformation (via imtranform) to the node points. I was checking out delaunayn, but it seems to work only on regular geometries. I want to apply the triangulation to a 3D image of an organ (ex: the brain) that has been segmented from an MR image. Do you have any suggestions?
Thank you very much. -Vijay
Vijay—I don’t know what you mean by “seems to work only on regular geometries.” delaunayn doesn’t have such a restriction so far as I know. Also, about using imtransform … it is used for applying 2-D spatial transformations to images, whereas you sound like you want to apply 3-D spatial transformations to points. You would want to use tformfwd and tforminv for that.
how to write pixel coordinates in file ?
Mikr—As far as I know, the commonly used image file formats such as TIFF, JPEG, PNG, etc., do not support storing spatial pixel coordinates within the file. There are format variations that do, such as GeoTIFF, but MATLAB does not have a function that writes a GeoTIFF file.
thanks, Steve
just started to learn matlab
and to clarify
matlab saves image files as a matrix of pixel coordinates
matrix can be seen by imread without semicolon
is this related to my previous question ? and does it make sence to export matrix from matlab ?
Mikr—An image in MATLAB is simply a matrix of pixel values. It can be saved (exported) to several common image file formats using imwrite.
thanks
but is it possible to see and write to file (Excel ?) that matrix of pixel coordinates ?
instead of exporting one image format to another
is that matrix which I see after command imread without semicolon ?
Mikr—You might want to take a look at the Getting Started section of the MATLAB documentation in order to become familiar with MATLAB usage and capabilities.
I look for answers before asking people…
“But we still can’t see the coordinates! That’s because imshow turns the axis display off. That brings us to step 3: Turn on the axis box and tick labels”
but actually how to save those coordinates I have seen using your article.
imwrite makes an image
save does not support images…
thanks
Hello Steve,
Thankyou very much for these blogs,they have been very helpful in my projects. I understand how imtransform work,but i want to know how exactly the transformation takes place,like how we place the input image pixels after transformation in the output space. In short i want to do the transformation without using any matlab function. I just want to know which book to refer.
Thankyou
swetha
Hi Steve,
I am trying to apply “tformfwd” with the
following T-matrix [sx 0 0 ; sy 0 0 ; 0 0 1]
in order to shrink a 2D contour.
I understood that the images gets scaled
with respect of the image origin (1,1). So
I need to supply the origion of the contour
to the “tformfwd” function.
I calculated the origin of the contour by using “regionprops.centroid” and added the coordinates to each pixel of my contour, afterwards I applied the transformation. By it only gave reasonable results for scaling factor 1/2 and I don´t know why?
Do you have any suggestions?
Thank you
markus
Swetha—How about Paul Heckbert’s Master’s thesis, “Fundamentals of Texture Mapping and Image Warping.” It’s available his web site.
Markus—Your description of what you were trying to accomplish and what you actually did is a bit vague. My only suggestion is that you apply a “sanity check” to your tform struct. Use tformfwd to transform a few points, and make sure that the points transform to the locations you expect. Also, make sure you are using the correct transform matrix for scaling - the scale factors should be on the diagonal. (I’m not sure whether your misplaced sy factor was just a typo.) Finally, do you really need all this machinery, anyway? Why don’t you just scale and shift the contour locations yourself? It might be a lot simpler.
Hi Steve,
thanks, you are right, I don´t need all this machinery. I solved it like this:
-shift the contour to the center (1,1) since the centroid of the contour was calculated,
-scaling
-shifting back
T-Matrix: this was just a typo :)
markus