
Locating the US continental divide, part 6 – Final computation and visualization
Today's post in my continental divide series demonstrates the final computational step and shows one procedure for visualizing the Pacific and Atlantic catchment basins.
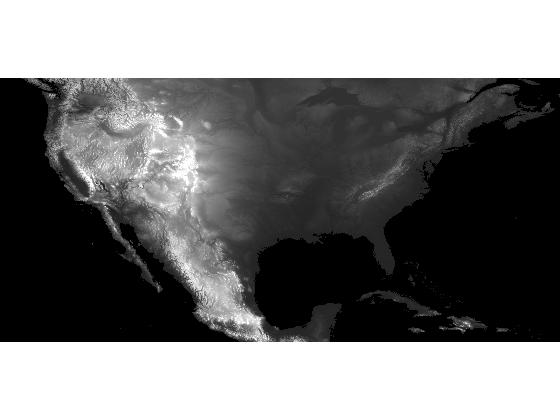
In my previous post, I modified the DEM (digital elevation model) data set so that its only regional minima were the two oceans.
s = load('continental_divide');
dem_modified = s.dem_modified;
imshow(dem_modified, [-500 3000], 'InitialMagnification', 'fit');

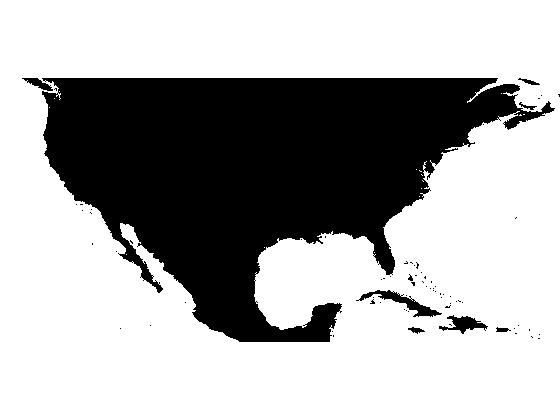
Since the modified DEM has only two regional minima, we expect to get only two catchment basins when we compute the watershed transform.
L = watershed(dem_modified);
max(L(:))
ans =

     2
I'll use label2rgb to display the Pacific catchment basin in green, the Atlantic catchment basin in blue, and the watershed ridge pixels (the continental divide) in red.
pacific = [0.2 1 0.2];
atlantic = [0.3 0.3 1];
ridge = [1 0 0];
rgb = label2rgb(L, [pacific; atlantic], ridge);
imshow(rgb, 'InitialMagnification', 'fit')

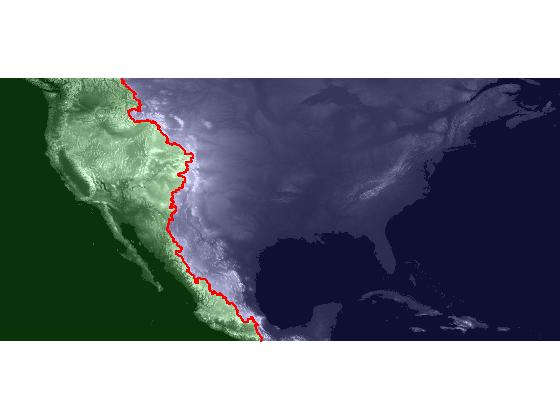
In a February blog post, I showed how to overlay one image transparently over another. We can use that technique here to achieve an effect similar to the visualization that Brian Hayes used in his blog post on the continental divide, where the ocean catchment basins are shown shaded with two different colors.
imshow(dem, [-500 3000], 'InitialMagnification', 'fit')
hold on
h = imshow(rgb);
set(h, 'AlphaData', 0.2);

It would be nice if we could make the watershed ridge line itself more visible. For example, if we could use plot, then we could use a thick line. But right now we just have the ridge line represented as zero-valued elements of a raster, instead of the x and y vectors we would need to pass to plot. We could use find to get the coordinates of the ridge pixels, but we wouldn't get them in the right order. One solution is to use bwboundaries to "trace" the zero-valued ridge pixels. Note that I specify 4-connectivity in the call to bwboundaries below. I've found that I get better results using 4-connectivity when tracing a single-pixel-wide stroke that's not a closed loop.
b = bwboundaries(L == 0, 4);
b1 = b{1};  % There's only 1 boundary found here - the ridge line.
x = b1(:,2);
y = b1(:,1);
plot(x, y, 'r', 'LineWidth', 2);
I have one more post planned for this series. Next time I'll gather together all the computational steps in a single, short script.
About this Series
This series explores the problem of computing the location of the continental divide for the United States. The divide separates the Atlantic and Pacific Ocean catchment basins for the North American continent.
As an algorithm development problem, computing the divide lets us explore aspects of data import and visualization, manipulating binary image masks, label matrices, regional minima, and the watershed transform.
- Part 1 - Introduction. Data import and display. multibandread, imshow.
- Part 2 - Watershed transform. watershed, label2rgb.
- Part 3 - Regional minima. imerode, imregionalmin.
- Part 4 - Ocean masks. binary image manipulation, bwselect.
- Part 5 - Minima imposition. imimposemin.
- Part 6 - Computing and visualizing the divide. watershed, label2rgb, bwboundaries.
- Part 7 - Putting it all together. One script that does everything, from data import through computation and visualization of the divide.
Data credit: GLOBE Task Team and others (Hastings, David A., Paula K. Dunbar, Gerald M. Elphingstone, Mark Bootz, Hiroshi Murakami, Hiroshi Maruyama, Hiroshi Masaharu, Peter Holland, John Payne, Nevin A. Bryant, Thomas L. Logan, J.-P. Muller, Gunter Schreier, and John S. MacDonald), eds., 1999. The Global Land One-kilometer Base Elevation (GLOBE) Digital Elevation Model, Version 1.0. National Oceanic and Atmospheric Administration, National Geophysical Data Center, 325 Broadway, Boulder, Colorado 80305-3328, U.S.A. Digital data base on the World Wide Web (URL: http://www.ngdc.noaa.gov/mgg/topo/globe.html) and CD-ROMs.
- Category:
- Continental divide


Comments
To leave a comment, please click here to sign in to your MathWorks Account or create a new one.