
Detecting Circular Objects in Images
Today's blog post was written by Spandan Tiwari, a developer on the Image Processing Toolbox team. Thanks, Spandan!
This example shows how you can use imfindcircles to automatically detect circles or circular objects in an image. It also shows how you can use viscircles to visualize the detected circles.
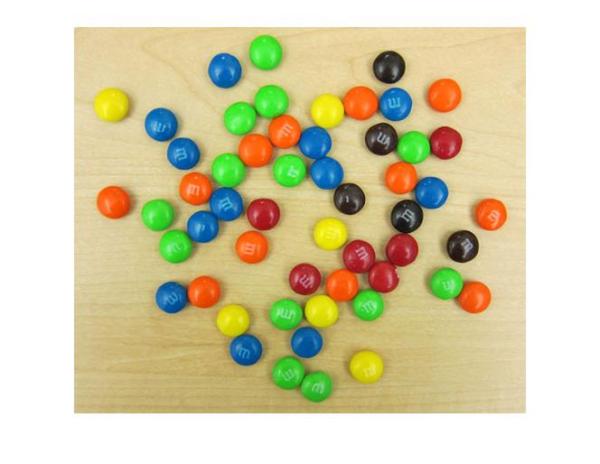
I was looking for an interesting image to show the use of imfindcircles when my fellow Mathworker Ashish reminded of the delicious M&M image from Steve's earlier post: What color is green?
url = 'https://blogs.mathworks.com/images/steve/2010/mms.jpg';
rgb = imread(url);
imshow(rgb)

Besides having plenty of sweet circles to detect, there are a few interesting things going on in this image from a circle detection point-of-view:
- There are M&Ms of different colors, which have different contrasts with respect to the background. On one end, the black ones clearly stand out on this background. On the other end, the yellow M&Ms do not contrast well with the background.
- Notice how several M&Ms are close together and almost touching each other. Touching and overlapping object boundaries is usually a challenging scenario for object detection.
So let's see how we can use imfindcircles to find the M&Ms.
First we need to specify a radius range to search for the circles. A quick way to find the appropriate radius range is to use the interactive tool imdistline to get an approximate estimate of the radii of various objects.
d = imdistline;

imdistline creates a draggable tool that can be moved to fit across an M&M and read off the numbers to get an idea of the radius. Most M&Ms have radius in the range of 16-19 pixels. I will use a slightly larger range of 15-20 pixels just to be sure. But before that let's remove the imdistline tool.
delete(d);
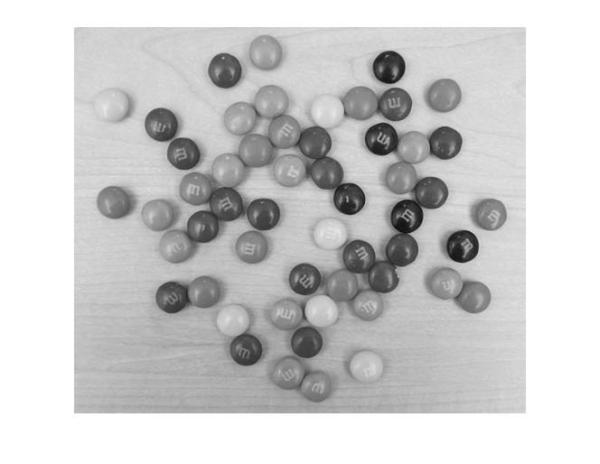
So, let's call imfindcircles on this image with the search radius of [15 20] pixels and see what we get. Before we do that, it is a good practice to ask whether the objects are brighter or darker than the background. This is needed because, by default, imfindcircles finds circular objects that are brighter than the background. In scenarios where the objects of interest are darker than the background, we need to set the parameter 'ObjectPolarity' to 'dark'. To answer whether the M&Ms in our image are brighter or darker than the background, let's look at the grayscale version of the image.
gray_image = rgb2gray(rgb);
imshow(gray_image);

We see that the background is quite bright and most of the M&Ms are probably darker than the background. So we will call imfindcircles with the parameter 'ObjectPolarity' set to 'dark'.
[centers, radii] = imfindcircles(rgb,[15 20],'ObjectPolarity','dark')
centers =

     []


radii =

     []
Well, the outputs centers and radii are empty, which means that no circles were found. This happens frequently because imfindcircles is a circle detector, and similar to most detectors, imfindcircles has an internal detection threshold that determines its sensitivity. In simple terms it means that the detector's confidence in a certain (circle) detection has to be greater than a certain level before it is considered a valid detection. imfindcircles has a parameter 'Sensitivity' which can be used to control this internal threshold, and consequently, the sensitivity of the algorithm. This is similar to the sensitivity control on the motion detectors used in home security systems. Coming back to our M&M image, it is possible that at the default sensitivity level all the circles are lower than the internal threshold, which is why we don't see any detections. By default, 'Sensitivity', which is a number between [0-1], is set to 0.85. So let's try increase 'Sensitivity' to say 0.9.
[centers, radii] = imfindcircles(rgb,[15 20],'ObjectPolarity','dark','Sensitivity',0.9)
centers =

   97.2101  108.7405
  349.1440   44.8708
  430.4268  243.4405
  368.8914  210.2235
  167.4823   48.9834
  256.0455  280.1922
  356.3265   86.3372
  191.0240  357.9989
  305.4986  190.8765
  210.4295  207.9475
  121.3942  141.0331
  396.4924  184.1435
  444.3143  299.8000
  363.3456  247.3126
  461.6538  208.0843


radii =

   18.5272
   18.1409
   18.2202
   18.0592
   18.8884
   17.7121
   18.6441
   17.7396
   17.7436
   18.2228
   17.9140
   18.1599
   17.8539
   18.5682
   17.8709
OK, so now we found some circles - 15 to be precise. centers contains the locations of circle centers and radii contains the estimated radii of those circles.
We can use function viscircles, which was also shipped in R2012a, to draw these circles on the image. The variables centers and radii can be passed directly to viscircles.
imshow(rgb);

h = viscircles(centers,radii);
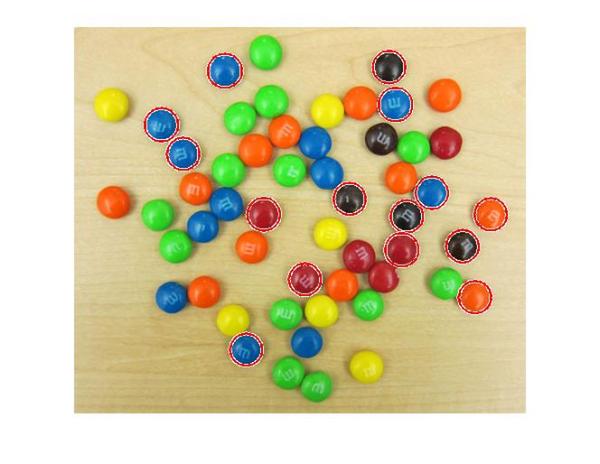
The circle centers seem correctly positioned and their corresponding radii seem to match well to the actual M&Ms. But still we are missing quite a few of them. What's up with that?
Let's try to increase 'Sensitivity' even more, to 0.95, and see what happens.
[centers, radii] = imfindcircles(rgb,[15 20],'ObjectPolarity','dark','Sensitivity',0.95);
size(centers)
ans =

    34     2
So increasing 'Sensitivity' gets us 34 circles. Let's plot these circles on the image again.
delete(h);
h = viscircles(centers,radii);
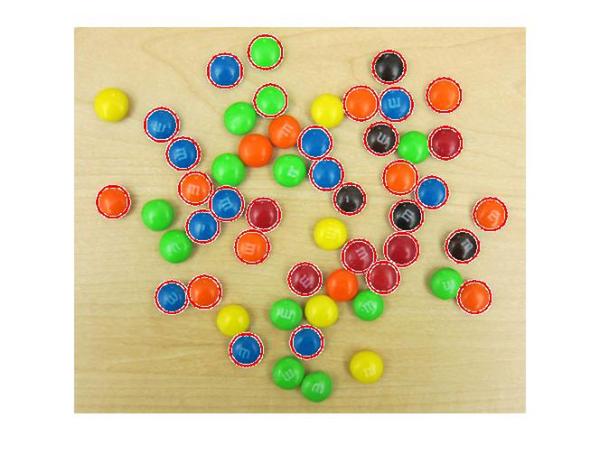
Much better.
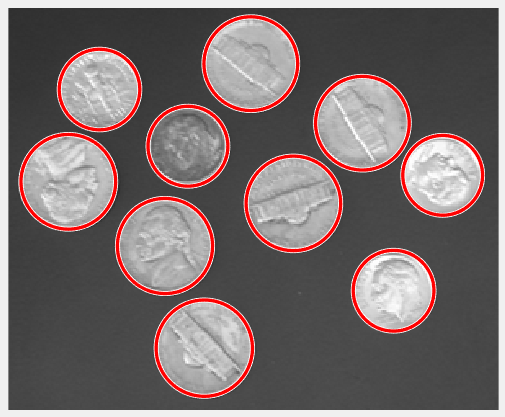
Now, under the hood, imfindcircles has two different methods for finding circles. So far we have been using the default method, which is the phase coding method. There's another method, popularly called the two-stage method, that is available in imfindcircles. Let's try to use the two-stage method and see what we get.
[centers, radii, metric] = imfindcircles(rgb,[15 20], ...
    'ObjectPolarity','dark','Sensitivity',0.95,'Method','twostage');

delete(h);

h = viscircles(centers,radii);
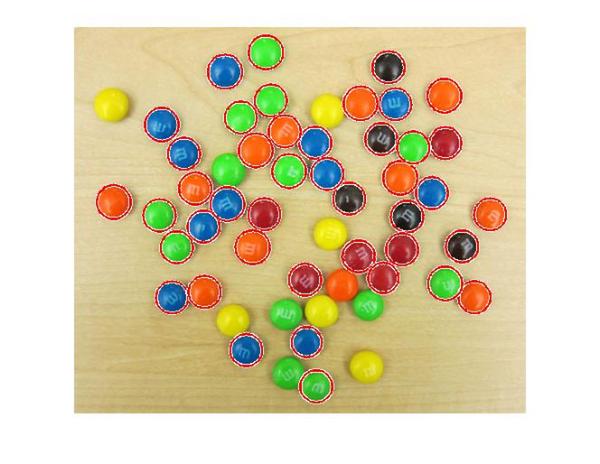
OK, great! The two-stage method is detecting more circles, at the Sensitivity of 0.95.
In general, these two method are complementary in that have they have different strengths. In my experience, phase coding method is typically faster and slightly more robust to noise than the two-stage method. But it can also need higher 'Sensitivity' levels to get the same number of detections as the two-stage method as we saw here.
Coming back to our image, it is curious that we are not picking up the yellow M&Ms in the image. Hmmm, the yellow M&Ms do not have a strong contrast with the background. In fact they seem to have very similar intensities as the background. Is it possible that the yellow M&Ms are not really 'darker' than the background as we are assuming. Let's check that out by looking at the grayscale version of this image again.
imshow(gray_image);
Indeed! The yellow M&Ms are almost the same intensity, maybe even brighter, as compared to the background. This suggests that we should change 'ObjectPolarity' to 'bright' to detect the yellow ones.
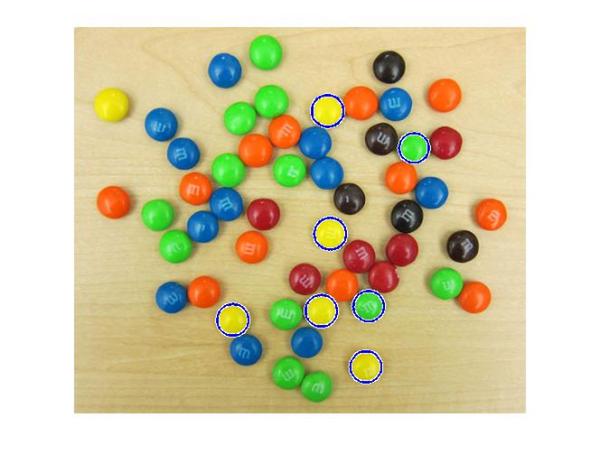
[centersBright, radiiBright] = imfindcircles(rgb,[15 20],'ObjectPolarity','bright','Sensitivity',0.95);
And let's draw the bright circles in a different color, say blue, by changing the 'EdgeColor' parameter in viscircles.
imshow(rgb);
hBright = viscircles(centersBright, radiiBright,'EdgeColor','b');

OK, so we got one of them. That's a start! These yellow ones are hard to find because of they don't stand out as well as others on this background. Let me introduce you to another parameter which might help us here - 'EdgeThreshold'. To find circles, imfindcircles uses only the edge pixels in the image. These edge pixels are essentially pixels with high gradient value. The 'EdgeThreshold' parameter controls how high the gradient value at a pixel has to be before it is considered an edge pixel and included in computation. A high value (closer to 1) of this parameter will allow only the strong edges (higher gradient values) to be included, whereas a low value (closer to 0) is more permissive and includes even the weaker edges (lower gradient values) in computation. In case of yellow M&Ms, since the contrast is low, we expect the boundary pixels (on the circumference of the M&M) to have low gradient values. So let's try to lower the 'EdgeThreshold' parameter to ensure that they are included in computation.
[centersBright, radiiBright, metricBright] = imfindcircles(rgb,[15 20], ...
    'ObjectPolarity','bright','Sensitivity',0.95,'EdgeThreshold',0.1);

delete(hBright);
hBright = viscircles(centersBright, radiiBright,'EdgeColor','b');
All right! We are now picking up most of the yellow ones, and some green ones too. Let's also draw the other M&Ms, which we found earlier, in red.
h = viscircles(centers,radii);
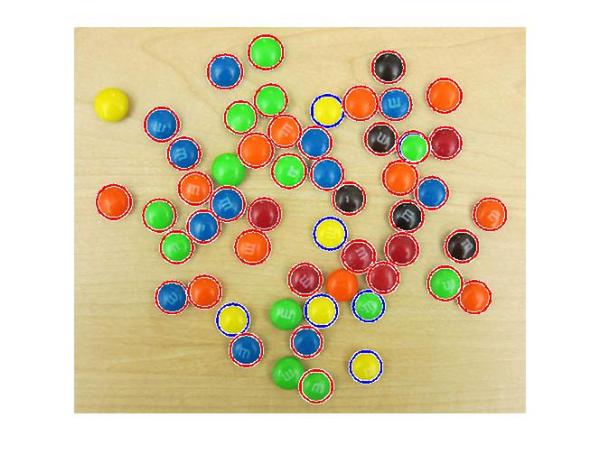
We are still missing a few of them, such as the yellow one of the left top corner. I am sure we can adjust the parameters to pick up on those as well. However, at some point on our journey to find all the M&Ms we will see some false circles showing up (M&Ms where there are none!). This highlights that there is always a trade-off between how many true circles you can find (detection rate) and how many false circles you get with them (false alarm rate). Both go hand in hand, i.e., getting more of the actual circles means a greater likelihood of getting false circles.
So, now that we have most of our circles let's have some fun. Let's try and draw these M&Ms in their own respective colors.
First let's collect all our circle centers and radii together.
centers = round([centers; centersBright]);
radii = [radii; radiiBright];
Also, let's smooth our image to remove some of the lighting and writing artifacts (the 'm's) from our M&Ms.
filt_rgb = imfilter(rgb,ones(5)/25);
Now we will extract the colors at the center of the circles. For this first I make a list of all the elements of the array that I want to get. Remember the center locations are stored in centers. But I want to get the color value at these locations, which means that I have to extract the values from all the three planes (along the third dimension) of this RGB image at those center locations.
To give an example, let's say we have two circles with centers example_centers = [10 20 ; 40 50 ]
So to get the color values we need to get the values from the following elements of the matrix. Here each row shows the element location in the 3-dimensional image matrix.
locs = [10 20 1 ;
        40 50 1 ;
        10 20 2 ;
        40 50 2 ;
        10 20 3 ;
        40 50 3 ]
There are many different ways you can do this in MATLAB. I like to do it using repmat and a simple trick using kron, which is the function for computing Kronecker product of two matrices.
example_centers = [10 20; 40 50];
locs = [repmat(example_centers,3,1) ...
     kron((1:3)',ones(size(example_centers,1),1))]
locs =

    10    20     1
    40    50     1
    10    20     2
    40    50     2
    10    20     3
    40    50     3
Similarly we can make a list of all the elements we need to extract for all the circle centers in centers. Note that the first and second columns of centers have the column and row location of the circle centers, respectively. Since we want the first column in 'locs' to be the row location we switch the columns of centers using fliplr.
locs = [repmat(fliplr(centers),3,1) kron((1:3)',ones(size(centers,1),1))];
Next, we convert these locations to linear indices using sub2ind.
center_idx = sub2ind(size(rgb),locs(:,1),locs(:,2),locs(:,3));
Finally we extract these elements from the smoothed M&M image.
cent_color = filt_rgb(center_idx);
Since 'cent_color' is a vector, we reshape it to get it in 3-column format where the three columns correspond to R, G, and B colors for the circle centers.
cent_color = reshape(cent_color,size(centers,1),3);
Now that we have the colors corresponding to each circle, we can plot these circles with the right colors. Remember to normalize the colors between [0-1] for plotting.
imshow(rgb)

for i = 1:size(centers,1)
    viscircles(centers(i,:),radii(i),'EdgeColor',double(cent_color(i,:))/255);
end
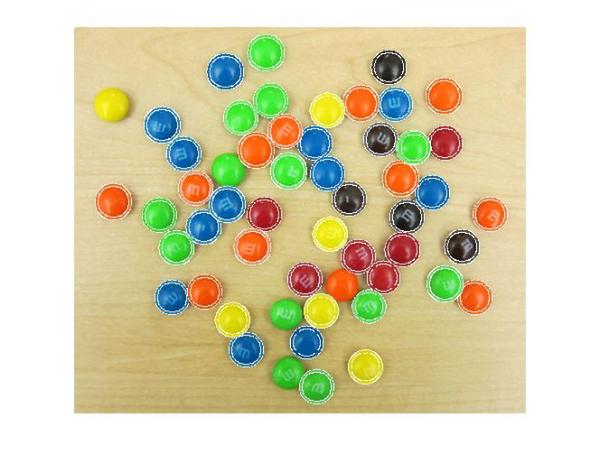
That looks about right. If you look closely, some circles are not exactly the same color as the M&Ms. This is because of there is variation in the color even within an M&M. This variation can be seen on closer look, as shown in Steve's post What color is green?.
Now that I have the circle colors extracted out what else can I do? Maybe I can simulate an M&M image of my own. Hmmm, what do I need to do for that? I see broadly two steps for doing this. First step is to paint the M&Ms with the right colors at the right locations. Second step is to fill in the background color.
For the first step of painting the M&Ms, we will use a simple trick from Linear Systems theory. Linear systems theory tells us that when we convolve a function with a shifted impulse (Dirac delta) function, we get the same function shifted to the location of the impulse, i.e. $f(t)*d(t-T) = f(t-T)$, where $f$ is the function, $d$ is the impulse function, and $*$ denotes convolution. Essentially, convolving a function with an impulse creates a copy of the function centered at the impulse location.
The first thing we need to do is create a blank canvas similar to our original image.
cartoon_rgb = zeros(size(rgb),class(rgb));
Next we fill in the right color values at the center locations for all the M&Ms in the image.
cartoon_rgb(center_idx) = cent_color(:);
imshow(cartoon_rgb)
These individual pixels of different colors are like digital 'impulses', (single-pixel wide, height corresponding to a color). Next we need to make a 'function', which in our case is just a circular mask (because the M&Ms are circular), to convolve with these impulses and make a copy of at each of these impulse locations. For simplicity, I use a circle of radius 17 pixels for all the M&Ms even though they have slightly different radii.
radius = 17;
circ_mask = double(getnhood(strel('ball',radius,radius,0)));
imshow(circ_mask, 'InitialMagnification', 500)
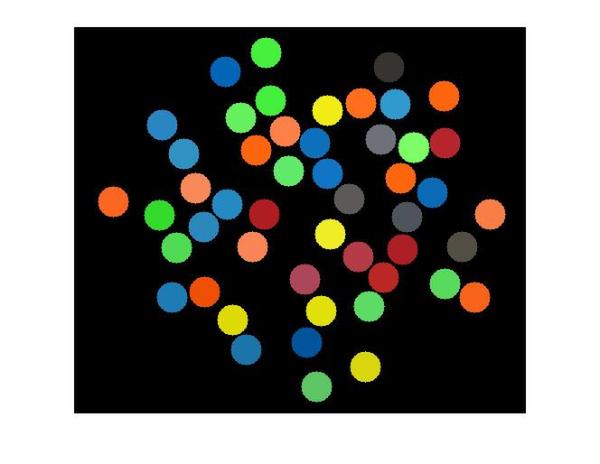
Finally we convolve the image with the colored impulses with the circular mask to paint the M&Ms at the right locations.
cartoon_rgb = imfilter(cartoon_rgb,circ_mask,'conv');
imshow(cartoon_rgb)
A word of caution about this trick here. You might have noticed we are working with multiple impulses simultaneously, i.e. we are not convolving the circular mask with just one impulse but a string of impulses. We are getting away with that because our impulses (circles) are well-separated (more than 2 x radius = 34 pixels apart) and the circles don't overlap. If that was not the case, we would see unwanted colors in the overlapping part of the circles due to superpositioning of the masks.
So now we have painted the colored M&Ms. All we have to do now is to paint the background. I just pick an RGB color to match the background.
bg_color = [235; 218; 175];
Next we need to find all the pixels that are part of the background. We do this by using the same convolution trick we used. We make an image with the 'impulses'.
bw = false(size(rgb,1),size(rgb,2));
bw(sub2ind(size(bw),centers(:,2),centers(:,1))) = true;
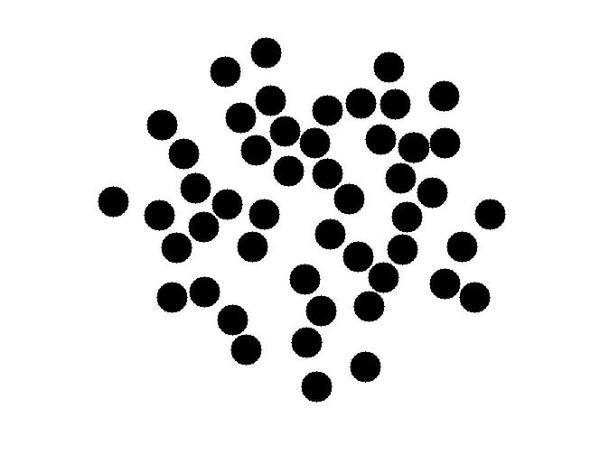
Then we convolve this image with a circular mask to get circles painted. Then we complement the image to highlight the background (in white) and record the locations (linear indices) of the pixels belonging to the background.
bw = imfilter(bw,circ_mask);
bw = imcomplement(bw);
imshow(bw)
bg_idx_gray = find(bw);
Now we will fill these pixels locations with the background color. Since this is a color image we need to do some work to fill the colors. We do this is in a way similar to what to we did to extract the colors for the circle center locations. First we find the linear indices of all the elements in the color image matrix that need to be filled.
bg_idx_color = [bg_idx_gray; numel(bw)+bg_idx_gray; 2*numel(bw)+bg_idx_gray];
Next we make a vector that has the color values that go into those elements. We do this by repeating the color values in bg_color once for each pixel location.
bg_fill_values = kron(bg_color,ones(size(bg_idx_gray)));
Finally we fill the color values in the background locations.
cartoon_rgb(bg_idx_color) = bg_fill_values;
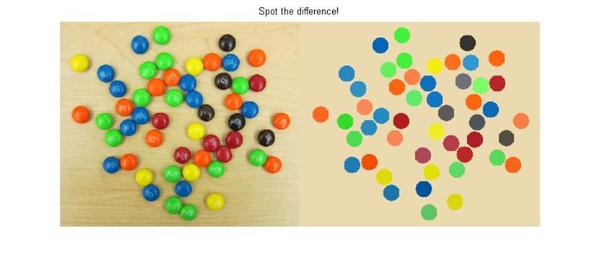
That's it. We have made our simulated M&M image and now let's see how it has come out. To view this, I will use a new function, imshowpair, introduced in R2012a. It has some great options for viewing and comparing two images. I will use the 'montage' option to view the original and simulated M&M images side-by-side. There are several other cool options in imshowpair, such as 'blend', which is my favorite. You should check it out.
So here you go: spot the difference!
imshowpair(rgb,cartoon_rgb,'montage');
title('Spot the difference!');
axis off;
Happy circle hunting!


Comments
To leave a comment, please click here to sign in to your MathWorks Account or create a new one.