Friday the 13th and the Datetime Method
Today is Friday, the 13th. In many parts of the world, today is regarded as unlucky. But I want to revisit an old question: is today unlikely? What are the chances that the 13th of any month falls on a Friday? Computing the answer makes use of a new MATLAB® feature, the datetime method.
I wrote about Friday the 13th in a blog post several years ago, Cleve's Corner, Friday the 13th. I am reusing a portion of that post today.
Contents
Leap Years
Leap years make our calendar a nontrivial mathematical object. The leap year rule can be implemented by this anonymous function.
leapyear = @(y) mod(y,4)==0 & mod(y,100)~=0 | mod(y,400)==0;
This says that leap years happen every four years, except for the turn of centuries not divisible by 400. Try a few year numbers.
    y = [2018 2020 2000 2100]';
    isleap = [y leapyear(y)]
isleap =
        2018           0
        2020           1
        2000           1
        2100           0
So, this year is not a leap year, the next one is in 2020. The turn of the century 2000 was a leap year, but 2100 will not be.
Calendars
The leap year rule implies that our calendar has a period of 400 years. The calendar for years 2000 to 2399 will be reused for 2400 to 2799. In a 400 year period, there are 97 leap years, 4800 months, 20871 weeks, and 146097 days. So the average number of days in a calendar year is not 365.25, but
dpy = 365+97/400
dpy =
  365.2425
We can compute the probability that the 13th of a month is a Friday by counting how many times that happens in 4800 months. The correct probability is then that count divided by 4800. Since 4800 is not a multiple of 7, the probability does not reduce to 1/7.
Datenum
For many years, computations involving dates and time have been done using a whole bunch of functions.
- clock
- datenum
- datevec
- datestr
- dateticks
- now
- weekday
Those functions have served us well, but they have some significant shortcomings. They are not particularly easy to use. The display formatting is limited. The floating point precision of datenum effectively limits the calculation of durations. There are no immediate plans to retire datenum and its friends, but something preferable is now available.
Datetime
The datetime object, introduced in R2014b, combines and extends these functions into one.
- datetime
The documentation for datetime is available online, or, from within MATLAB, with the command
doc datetime
For example, here is the date and time when I am publishing this post.
d = datetime('now')
d =
  datetime
   13-Apr-2018 21:21:19
I can specify a custom display format with
d = datetime(d,'Format','eeee, MMMM d, yyyy HH:mm:ss')
d =
  datetime
   Friday, April 13, 2018 21:21:19
The available display formats include support for an international standard, ISO 8601.
Nanoseconds
datetime's are much more precise than datenum's can ever hope to be. Try this
hms = datetime(d,'Format','HH:mm:ss.SSS')
hms =
  datetime
   21:21:19.502
We see that d is carrying fractional seconds to at least three places beyond the decimal point. How about nanoseconds?
    secperday = 24*60*60
    nano = 1.e-9/secperday
    hms = datetime(d,'Format','HH:mm:ss.SSSSSSSSS')
    hmsplusnano = hms + nano
secperday =
       86400
nano =
   1.1574e-14
hms =
  datetime
   21:21:19.502000000
hmsplusnano =
  datetime
   21:21:19.502000001
A nanosecond is four orders of magnitude smaller than roundoff error of datenum's in this era. Compare
    nano
    epsofdatenum = eps(datenum(d))
nano =
   1.1574e-14
epsofdatenum =
   1.1642e-10
I am pleased to reveal some details about the arithmetic in datetime. The object is using a form of quadruple precision known as double-double. In fact, the second half of the 112-bit format is stored as the imaginary part of the data field, as you see in the following.
disp(struct(hmsplusnano))
Warning: Calling STRUCT on an object prevents the object from hiding its
implementation details and should thus be avoided. Use DISP or DISPLAY to see
the visible public details of an object. See 'help struct' for more information.
                      UTCZoneID: 'UTC'
              UTCLeapSecsZoneID: 'UTCLeapSeconds'
                  ISO8601Format: 'uuuu-MM-dd'T'HH:mm:ss.SSS'Z''
                        epochDN: 719529
                   MonthsOfYear: [1×1 struct]
                     DaysOfWeek: [1×1 struct]
                     dateFields: [1×1 struct]
    noConstructorParamsSupplied: [1×1 struct]
                           data: 1.5237e+12 + 1.0000e-06i
                            fmt: 'HH:mm:ss.SSSSSSSSS'
                             tz: ''
                     isDateOnly: 0
Proleptic
The summary description in the datetime documentation describes some important features of the object, which has nearly 100 methods defined.
datetime arrays represent points in time using the proleptic ISO calendar. datetime values have flexible display formats up to nanosecond precision and can account for time zones, daylight saving time, and leap seconds.
I had to look up the definition of "proleptic". In this context it means the calendar can be extended backwards in time to apply to dates even before it was adopted.
Vectorize
Let's get on with Friday the 13th. Like most things in MATLAB datetime works with vectors. The statements
    y = 2000;
    m = 1:4800;
    t = 13;
    v = datetime(y,m,t);
produce a row vector of 4800 datetime's for the 13th of every month. The first few and last few are
    fprintf('  %s',v(1:4))
    fprintf('  ...\n')
    fprintf('  %s',v(end-3:end))
  13-Jan-2000  13-Feb-2000  13-Mar-2000  13-Apr-2000  ...
  13-Sep-2399  13-Oct-2399  13-Nov-2399  13-Dec-2399
The statement
w = weekday(v);
produces a row vector of 4800 flints between 1 (for Sunday) and 7 (for Saturday). The first few and last few are
    fprintf('%3d',w(1:4))
    fprintf('  ...')
    fprintf('%3d',w(end-3:end))
5 1 2 5 ... 2 4 7 2
Now to get the counts of weekdays, all we need is
c = histcounts(w)
c =
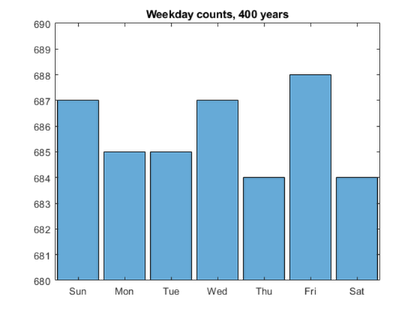
   687   685   685   687   684   688   684
There you have it. The count for Friday, 688, is higher than for any other day of the week. The 13th of any month is slightly more likely to fall on a Friday.
The probabilities are
p = c/4800
p =
    0.1431    0.1427    0.1427    0.1431    0.1425    0.1433    0.1425
Compare these values with their mean, 1/7 = 0.1429. Four probabilities are below the mean, three are above.
Categorize
Let's pair the counts with the days of the week, using a categorical variable, introduced in R2013b.
    c = categorical(w,1:7,{'Sun' 'Mon' 'Tue' 'Wed' 'Thu' 'Fri' 'Sat'});
    summary(c)
     Sun      Mon      Tue      Wed      Thu      Fri      Sat
     687      685      685      687      684      688      684
When we plot a histogram the appropriate labels are provided on the x-axis. Friday the 13th is the winner.
    histogram(c)
    set(gca,'ylim',[680 690])
    title('Weekday counts, 400 years')

Thanks
Thanks to Peter Perkins at MathWorks. I learned a lot from him while working on this post.


コメント
コメントを残すには、ここ をクリックして MathWorks アカウントにサインインするか新しい MathWorks アカウントを作成します。