Brush up on your data
We’ve already received great feedback on Data Brushing, a new MATLAB R2008a feature that is closely related to Data Linking.
Data Brushing allows you to graphically edit the data in a plot, allowing you to clean up the data, or focus in on a particular region. Unlike Plot Tools, which allow you to edit the graphics of the plot (labels, legend, colors, etc), this feature works on the actual data in the plot.
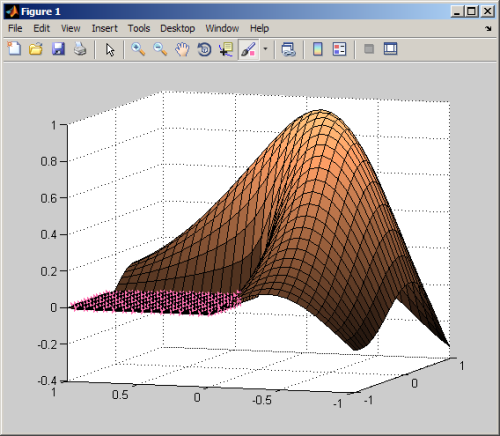
Here I’ve taken the L-shaped membrane (MathWorks logo) and brushed the flat part. I changed the color of the brushing from the default red to hot pink for better contrast (The color can be changed by clicking the drop-down button next to the brush icon).
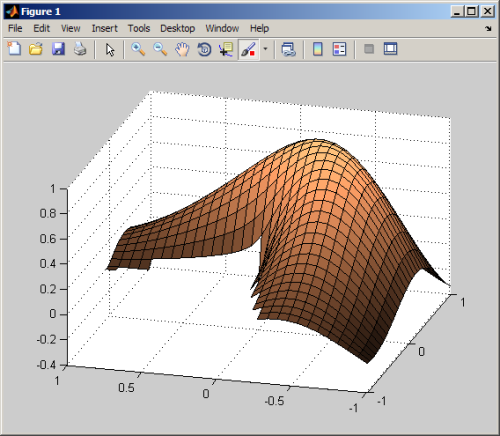
Right-clicking the brushed area gives options to delete the data (for cleaning up outliers), replacing the data with a new value, or various copy options. Here’s what happens if I replace the flat area with NaN’s:
You can also drag the highlighted region into Microsoft Excel or a text editor and it will give you a table of the highlighted data.
As a bonus, if you have data linking turned on, the changes are reflected back in the workspace. If you haven’t already watched the tutorial video, I suggest you take a look at it.
By combining brushing with linking, you get a nice tool for data exploration and data manipulation that allows you to work in one domain, when the data you care about is visualized in another domain. Two great uses come to mind: filter design and principal component anaylsis–basically anytime you want to look at the same data in multiple ways at the same time. The above linked video shows this with highway safety data.
These tools give a lot of flexibility and ease of manipulating graphs. Please exercise responsible presenting.
- Category:
- Data Tools


Comments
To leave a comment, please click here to sign in to your MathWorks Account or create a new one.