 Cleve’s Corner: Cleve Moler on Mathematics and Computing
 The MATLAB Blog
 Guy on Simulink
 MATLAB Community
 Artificial Intelligence
 Developer Zone
 Stuart’s MATLAB Videos
 Behind the Headlines
 File Exchange Pick of the Week
 Hans on IoT
 Student Lounge
 MATLAB ユーザーコミュニティー
 Startups, Accelerators, & Entrepreneurs
 Autonomous Systems
 Quantitative Finance
 MATLAB Graphics and App Building

Guest Writer: Gianluca Carnielli
Gianluca is an application engineer at MathWorks based in Italy. While he supports MATLAB users in the development of applications in all sorts of engineering... read more >>
Derivative of state ‘1’ in block ‘X/Y/Integrator’ at time 0.55 is not finite
Inspiring Connections during the “Women at MathWorks” Breakfast Mixer
Streamlining the Medical Imaging Software Development Lifecycle
Three favorites from TIME Magazine’s “Best Innovations of 2023”
New ThingSpeak IoT Examples and Curriculum Module: Hardware Connectivity in Action
Startup Shorts: Flux Marine Redefines Marine Propulsion Through Electrification
Developing Inertial Navigation Systems with MATLAB – From Sensor Simulation to Sensor Fusion
Deep Learning in Quantitative Finance: Multiagent Reinforcement Learning for Financial Trading
Animating Science: Creating Time-Sensitive Animations with MATLAB
Guest Writer: Gianluca Carnielli
Gianluca is an application engineer at MathWorks based in Italy. While he supports MATLAB users in the development of applications in all sorts of engineering... read more >>


Guest Writer: Dinesh Kavalakuntla
Dinesh is a Software Engineer on the MATLAB App Designer team at MathWorks. He began his journey with MathWorks in 2019, bringing with him a strong background... read more >>

Guest Writer: Robert Philbrick
Robert Philbrick is a principal engineer responsible for new interactive App Designer workflows. He joined MathWorks in 2012 and has made many contributions to... read more >>

Guest Writer: Kristen Amaddio
Kristen Amaddio is the Senior Team Lead for the MATLAB UI Components team. She first joined MathWorks as part of the Engineering Development Group (EDG) in 2016,... read more >>
Guest Writer: Afiq Azaibi
Today's R2024a feature highlight is written by Afiq Azaibi, a developer on the Charting Team and a returning contributor to the Graphics and App Building blog. See... read more >>

There are dozens of new graphics and app building features in the MATLAB R2024a release. Here are some highlights to keep you in the know! Let us know which topics you’d like to learn more about and… read more >>
Guest Writer: Ken Deeley
Ken is an application engineer in Cambridge, UK, supporting MathWorks users with their technical computing projects. Ken joined the MathWorks customer training team... read more >>

Guest Writer: Eric Ludlam
Joining us again is Eric Ludlam, development manager of MATLAB’s charting team. Discover more about Eric on our contributors bio page.
MATLAB Graphics supports... read more >>
In 1979, an English rock band produced what Rolling Stone would describe as one of the best albums of all time with an album cover that would become iconic in data visualization. Joy Division's... read more >>
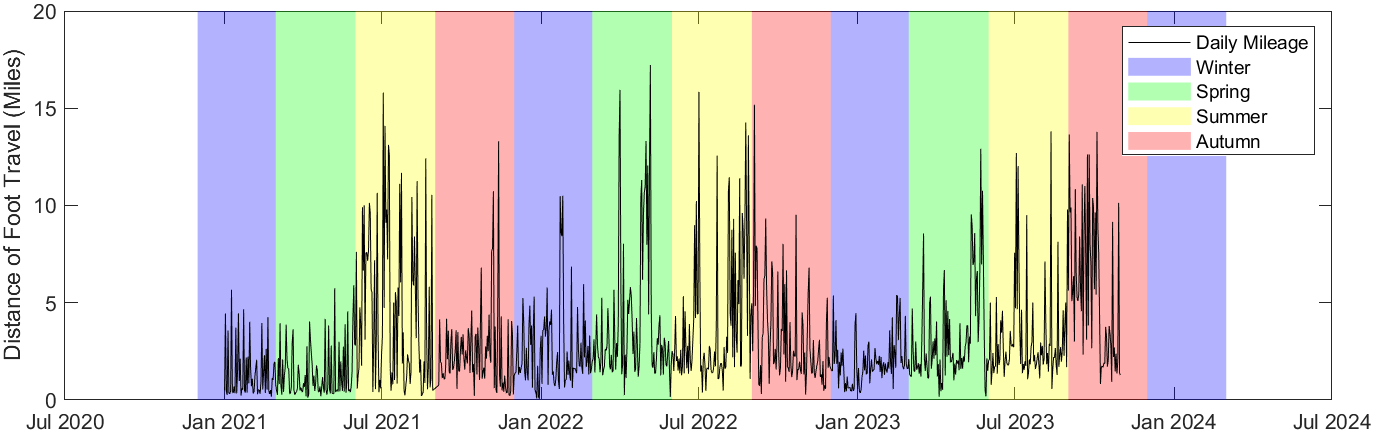
Guest Writer: Afiq Azaibi I’m happy to introduce Afiq Azaibi, a developer on the Charting Team at MathWorks and avid traveler. Afiq’s first contributions to the team have become... read more >>
These postings are the author's and don't necessarily represent the opinions of MathWorks.