Using meta-analysis to predict the outcome of next week’s election
You may have heard about the upcoming US election. There’s been a ‘bit’ of news coverage on the subject. Going back to the purpose of the “Behind the Headlines” blog, this post is to share the role MATLAB plays in an issue that drives today’s news: It’s hard to imagine a recent news story that has received more coverage, in the US at least, than next week’s election.
Throughout this election, polls and pollsters have played a significant role, just as they did for the Brexit vote earlier this year. In fact, NBC News recently compared the polling in both elections in their article “No, the Presidential Election Will Not Be the Next ‘Brexit’ for Pollsters.” This post turns to psephology, the study of scientific analysis of elections, to examine polling results.
Princeton Election Consortium
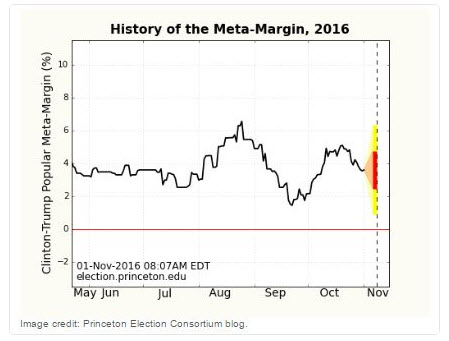
The Princeton Election Consortium is a blog written by Dr. Sam Wang. In addition to his role as a professor of molecular biology and neuroscience at Princeton University, Dr. Wang authors the PEC blog which utilizes meta-analysis to predict the winner of the Electoral College. Meta-analysis is a statistical approach that combines the results from multiple studies in an effort to increase the accuracy as compared to the individual poll results. It is often used to resolve uncertainty when polls disagree.
Meta-analysis of state polls provides more objectivity and precision than looking at a single poll and gives an accurate, current snapshot of the state of play. Over the course of the campaign, the PEC site has attracted over a million visits.
In 2004, the median decided-voter calculation from PEC on Election Eve captured the exact final outcome. The 2008 PEC calculation provided results based on decided-voter polling from all 50 states, and in the closing week of the campaign was within 1 electoral vote of the final outcome. In 2012, PEC’s electoral vote median exactly matched the final outcome between President Barack Obama and challenger Gov. Mitt Romney.
How MATLAB is used
Professor Wang uses MATLAB for his calculations throughout the site. Here are some pages with references and/or MATLAB code.
- About the Meta-Analysis
“These calculations are based on state polls from many polling organizations. The data source for 2016 (as in 2008 and 2012) is HuffPost pollster.com. The data are fed through MATLAB scripts (1) (2) (3) (4) to mathematically compute all of the results shown.” - The short-term presidential predictor (with MATLAB) (2012) explains and shows the Meta-Margin predictions.
- For fellow geeks
“If you want to delve into the Meta-Analysis further, many files you will need are here. The scripts and data files mentioned here can be found in the Geek’s Directory. All of the files in that directory are linked to the live versions currently running the calculations.” - MATLAB code for unrolling a moving average
- MATLAB was also used by Professor Wang in his calculations on the impact of gerrymandering. The MATLAB gerrymandering code is available here.
So here’s to the end of the election, and thankfully, the end of political ads for now. Click here to see the latest forecast at the top of the PEC page.


Comments
To leave a comment, please click here to sign in to your MathWorks Account or create a new one.