
What does Guinness beer and gerrymandering have in common?
What possibly could one the world’s oldest beers and gerrymandering, the practice of manipulating district boundaries in order to obtain a political advantage, have in common?
Statistics.
More specifically, a well-known statistical analysis methodology. But before we go into the specifics, a bit on the issue of gerrymandering:
Gerrymandering is under Constitutional scrutiny
The Supreme Court of the United States heard arguments in a case on the constitutionality of partisan gerrymandering last month. The case, Gill v. Whitford, concerns the practice of strategically drawing voting districts within states to favor one political party.
According to the Washington Post, the court will consider “whether gerrymandered election maps favoring one political party over another violate the Constitution, a potentially fundamental change in the way American elections are conducted.”
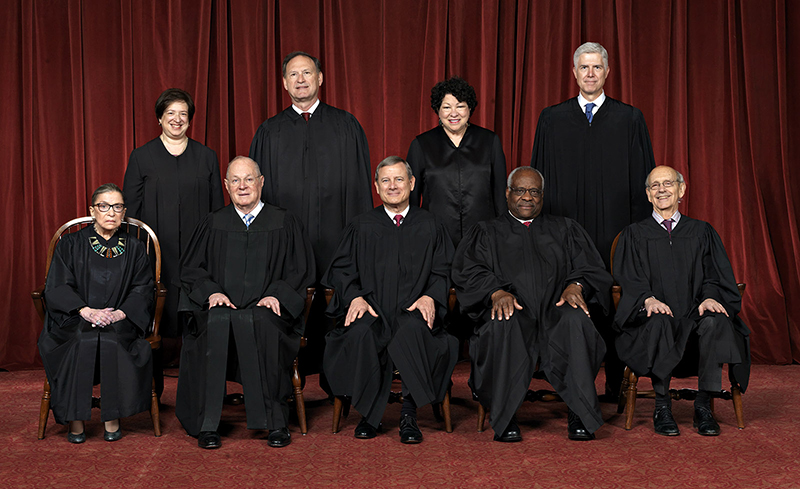
Image Credit: supremecourt.gov
Data analysis and gerrymandering
The term Gerrymander comes from the combining the last name of the Governor of Massachusetts in 1812, “Gerry”, and the word “salamander”. After redrawing the districts around Boston to favor his political party, one district was thought to be shaped like a salamander.

Printed in March 1812, this political cartoon was drawn in reaction to the newly drawn state senate election district of South Essex created by the Massachusetts legislature to favor the Democratic-Republican Party candidates of Governor Elbridge Gerry over the Federalists. Image Credit: Wikipedia.
In 1812, gerrymandering typically involved odd-shaped districts that favored the party in power. With the advent of computer simulations and data science, gerrymandering is often harder to detect from visual inspection of mapped districts. The districts can be uniform in shape but still provide a distinct political advantage to one of the parties.

Keith Gaddie, an election expert from the University of Oklahoma, provided data that helped Wisconsin Republicans enact the redistricting legislation that is being challenged in Gill v. Whitford. He didn’t draw the maps. He created ways to run thousands of computer simulations and gave the data to those who drew the maps. (He no longer helps state legislatures draw new district lines.)
Sam Wang, professor of neuroscience at Princeton University, and Brian Remlinger, statistical research specialist for the Princeton Gerrymandering Project, explained how gerrymandering occurs in their article Can Math Assist in Saving Democracy?
“Partisan gerrymandering is perpetrated using two complementary methods: cracking and packing. “Packing” occurs when as many supporters of one party as possible are crammed into a small number of districts, creating a few overwhelming wins for the victim party. The remaining members of the victim party are then “cracked,” or spread evenly across a large number of districts that the gerrymandering party can dominate. Fortunately, cracking and packing create a distinctive statistical pattern that can be detected with the help of a little math.”
Can data analysis prove partisan gerrymandering?
Referencing the Gill v. Whitford case, The American Prospect stated, “A key question for the Court will be whether neutral statistical tools can reliably detect partisan gerrymanders.”
According to Dr. Wang, “Luckily, cracking and packing creates a distinctive pattern of wins for both the perpetrating and victimized parties, where the victim party wins its few seats by overwhelming margins and the perpetrating party wins its many seats by considerably lower margins. This pattern, and thus partisan gerrymanders, can be detected with the help of a little math.”
One of the tests Dr. Wang recommends for determining if gerrymandering occurred is the t-test. This statistical test can check for a pattern of lopsided outcomes. It also can check for the probability that the pattern occurred by chance. “If the outcome was unlikely to have occurred by chance alone, and the outcome favors one party, it’s a possible indication that the state suffered a partisan gerrymander,” states Wang.
The MATLAB files and data used by Professor Wang to aid in the analysis of gerrymandering for the Stanford Law Review article are available here.
Now back to the Guinness beer connection
William S. Gosset was a brewer for Guinness from 1899 to 1937. He also developed the t-test. In the article, The Guinness Brewer Who Revolutionized Statistics, Dan Kopf stated, “One of the greatest minds in 20th Century statistics was not a scholar. He brewed beer.”
Yes, the statistical analysis that could possibly change American elections was originally used to determine the quality of hops used in the brewing process from a small sample size.

Image Credit: Guinness.com
Gosset’s work is responsible for inspiring the concept of statistical significance, industrial quality control, efficient design of experiments, and consistently great tasting beer. Soon, it could also be critical to changing the way voting districts in the United States are created.


Comments
To leave a comment, please click here to sign in to your MathWorks Account or create a new one.