 Cleve’s Corner: Cleve Moler on Mathematics and Computing
 The MATLAB Blog
 Guy on Simulink
 MATLAB Community
 Artificial Intelligence
 Developer Zone
 Stuart’s MATLAB Videos
 Behind the Headlines
 File Exchange Pick of the Week
 Hans on IoT
 Student Lounge
 MATLAB ユーザーコミュニティー
 Startups, Accelerators, & Entrepreneurs
 Autonomous Systems
 Quantitative Finance
 MATLAB Graphics and App Building
The scary combination of “rapid intensification” and “slower decay” in hurricanes
The rapid intensification and slower decay in recent hurricanes provide a terrible “one-two” punch, increasing storm surges and wind speeds at landfall while expanding the total area affected by the storms. The day before Hurricane Idalia made landfall in Florida, it traveled through some of the warmest waters on the planet, making it stronger at landfall and allowing it to travel further before losing its damaging strength.
Scientists are working to understand these storms better and have published papers that cover topics ranging from modeling intensification, improving predictions, and finding ways to minimize loss of property and life from these increasingly frequent disastrous storms.
Rapid intensification
On Tuesday afternoon, Idalia strengthened further to a Category 2, with sustained winds of 100 mph. Overnight, it rapidly intensified to a Category 3 and then Category 4, with winds of 130 mph early Wednesday.
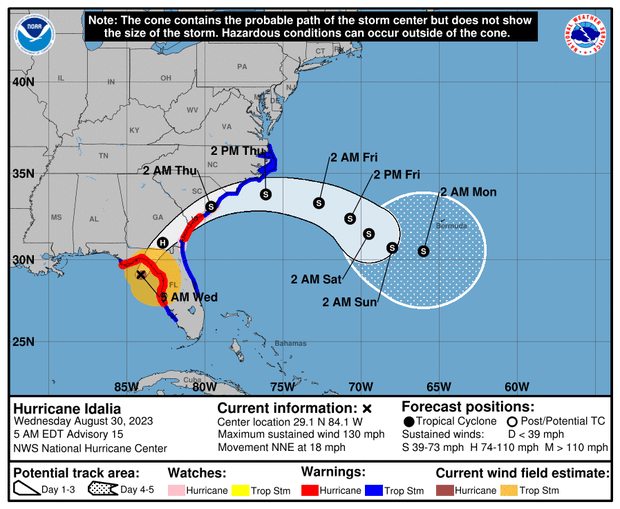
Idalia’s projected strength and path through early next week. Image credit: NOAA/CBS News
“Rapid intensification is associated with a sharp increase in intensity in a short amount of time, and consequently, the threat posed by the storm significantly increases,” said Phil Klotzbach, a research scientist in the Department of Atmospheric Science at Colorado State University.
According to The Washington Post, “In the Atlantic basin, which includes the Gulf of Mexico, 16 of the 20 hurricanes that formed during 2021 and 2022 rapidly intensified. Since 2017, seven rapidly intensifying storms have strengthened to at least a Category 4 (winds of at least 130 mph) before making landfall in the United States, together causing or contributing to at least 3,381 deaths and resulting in at least $496 billion in damage, according to reports compiled by the National Hurricane Center.”
Until recently, rapidly intensifying storms were less common. Tropical storms historically have taken several days to grow into powerful hurricanes, but with human-caused climate change, rapid intensification is becoming a more common occurrence, Allison Wing, an assistant professor of atmospheric science at Florida State University, told CNN.
Researchers from The Image Processing Laboratory, University of Valencia, turned to machine learning to predict a hurricane’s potential for intensification potential in the Atlantic and Pacific oceans. Their research, Advanced Machine Learning Methods for Major Hurricane Forecasting, was published in Remote Sensing. Their framework looks to identify the most important cloud structural parameters in GOES imagery and use these structures to identify which storms can potentially evolve into major hurricanes.
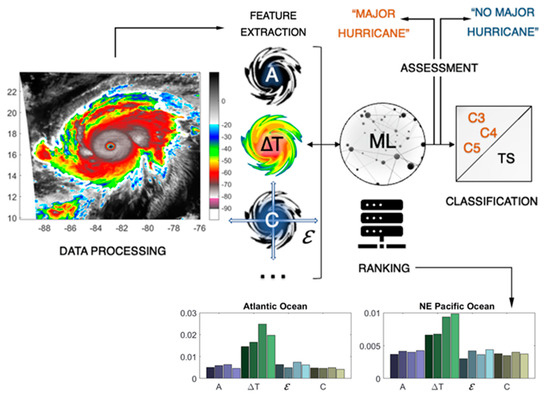
The hybrid machine learning approach developed in the study. Image credit: Javier Martinez-Amaya, Cristina Radin, and Veronica Nieves.
GOES (Geostationary Operational Environmental Satellite) imagery refers to the images captured by the GOES series of satellites. These satellites are operated by the National Oceanic and Atmospheric Administration (NOAA) and continuously monitor weather conditions from a geostationary orbit. GOES imagery includes visible, infrared, and water vapor channels, which are used to observe and track weather patterns, clouds, storms, and other atmospheric phenomena in real time.
Their framework was able to more accurately identify the end intensity of major hurricanes when rapid intensification occurred, compared to existing techniques such as statistical analysis. They employed a random forest algorithm. Their MATLAB code for sea-level reconstruction data is available here.
Their study demonstrated that integrating the prominent cloud features of a tropical cyclone, including the anatomy and temperature, in a machine learning approach is suitable as a benchmark for diagnosing a possible transition into a major hurricane.
Slower decay
Back to Idalia: “We’re [going to] see not just the storm surge but potential for damaging winds extending well inland all the way across portions of north Florida, into southern Georgia, into places like Savannah, Hilton Head. We have hurricane warnings in effect for the fast-moving hurricane. It’s going to bring those winds really far inland today and tonight,” Michael Brennan, director of the National Hurricane Center, told “CBS Mornings” on Wednesday.
Not only are storms intensifying before landfall, but the same storms also carry more moisture inland, furthering their destructive results. According to CNN, “A 2020 study published in the journal Nature found storms are moving farther inland than they did five decades ago. Hurricanes, which typically weaken after moving over land, have been raging longer after landfall in recent years. The study concludes that warmer sea surface temperatures are leading to a “slower decay” by increasing moisture that a hurricane carries.”
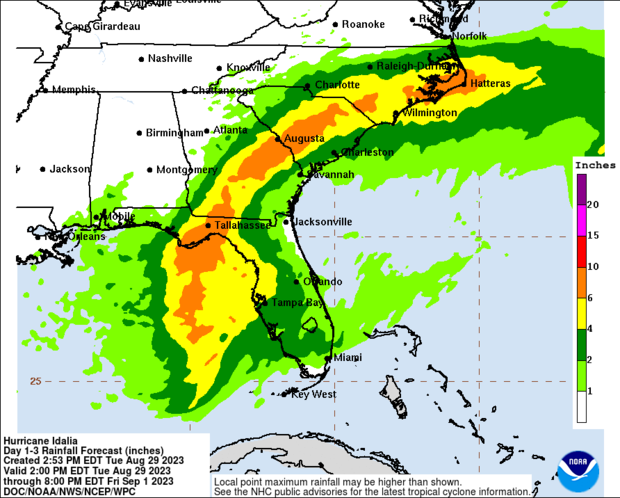
Predicted rainfall from Hurricane Idalia on days one through three. Image credit: NOAA/CBS News.
In the study referenced by CNN, “Slower decay of landfalling hurricanes in a warming world,” the researchers analyzed 50 years of intensity data of hurricanes that made landfall in the North Atlantic. They found the slowdown in the decay over time is in direct proportion to a contemporaneous rise in the sea surface temperature. Specifically, a typical hurricane in the 1960s lost 75% of its intensity in the first 24 hours after landfall. Today, the decay is only about 50% in the same 24-hour period, meaning the devastating effects last longer and can travel further inland.
They utilized the data from several hurricanes from 1967 on, using the MATLAB function land_or_ocean to determine which results to include in their study. The team defined landfall as four continuous inland data points, using the first inland data point as strength at landfall. Land_or_ocean is available on MathWorks File Exchange. The visualization of the hurricane paths contained in the study is shown below.

Hurricanes tracked from 1967 to 1992 (in blue) and 1993 to 2018 (in red). Image credit: L. Li and P. Chakraborty.
MATLAB was also used to determine the decay timescale. The graph below shows the slower decay experienced in storms post-1993, shown in red. The data is available from NOAA.

Histogram and probability density of intensity. Image credit: L. Li and P. Chakraborty.
Additional climate studies welcome
This is only a sampling of studies improving our understanding of hurricanes and other climate phenomena. If you are involved in a study that you would like to share, please reach out! I welcome your ideas and guest posts.


댓글
댓글을 남기려면 링크 를 클릭하여 MathWorks 계정에 로그인하거나 계정을 새로 만드십시오.