
One Million ThingSpeak Channels!
Christopher Stapels, the product marketing manager for ThingSpeak, told me that we crossed ONE MILLION CHANNELS of IoT data on ThingSpeak. We have come along way over the years. The first channel that we created got the Channel ID of 1. We deleted the channel to test if the channel deletion feature works. Then, we created a second channel, sent data to it, cleared it, and deleted it. The oldest active ThingSpeak channel is Channel 3. It’s still collecting weather data from my parent’s house after 10 years. I never expected to see seven-digit channel ID numbers, like Channel 1018612 based in Oslo, Norway.
Thanks to all of our users who keep collecting data, adding devices, and analyzing data on ThingSpeak! This is a huge milestone for all of us and you are making an impact on IoT all around the world.
To commemorate one million channels, Christopher saved the number of channels at the beginning of each year to an array and used MATLAB to fit a power function to the data. You can do this using a MATLAB Visualization in ThingSpeak. The fit parameters are a = 1693 and b=2.277 for the model shown here.
![]()
According to a Business insider article, there will be 25 billion IoT devices by 2025. If the present rate continues, at least .1% of those devices can be on ThingSpeak by 2024 when we reach 2.5 million channels!
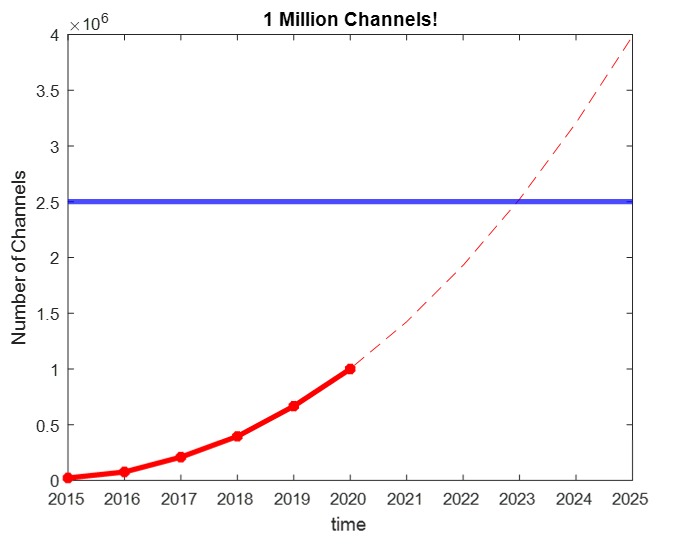
Here’s some MATLAB code to generate this plot and estimate the number of the ThingSpeak channels in the future.
% Gather data
dates=2015:2020;
absYears=dates-2014;
numChan=[22155,75957,208835,394780,666479,1000000];

% Plot the data
plot(dates,numChan,'r*-','linewidth',3);
xlabel('time');ylabel('Number of Channels');title('1 Million Channels!');
[xData, yData] = prepareCurveData( absYears, numChan );

% Set up fittype and options
ft = fittype( 'power1' );
opts = fitoptions( 'Method', 'NonlinearLeastSquares' );
opts.Display = 'Off';

% Fit model to data
[fitresult, gof] = fit( xData, yData, ft, opts );
hold;
extendRange = 2015:2025;
plot(extendRange,fitresult(extendRange-2014),'r--');
yline(2.5e6,'b','LineWidth',3);
We wanted to thank you again. We look forward to the next million channels and supporting your IoT journey. Let us know in the comments what you are doing or planning to do with ThingSpeak and what functionality that will help you along the way.


댓글
댓글을 남기려면 링크 를 클릭하여 MathWorks 계정에 로그인하거나 계정을 새로 만드십시오.