String Annotations for Plots
Did you know that you can customize the direction of text in MATLAB plots? There are times when such annotations work better
than if they were purely horizontal or vertical.
 Now change the label so it is at an angle, something I might want if I were planning to label several more points on the graph.
Contents
Sunspot Data
Let's look at some sunspot data. First I'll load it into MATLAB.s = load('sunspot.dat');
Separate the year from the actual number of sunspots.
year = s(:,1);
spots = s(:,2);
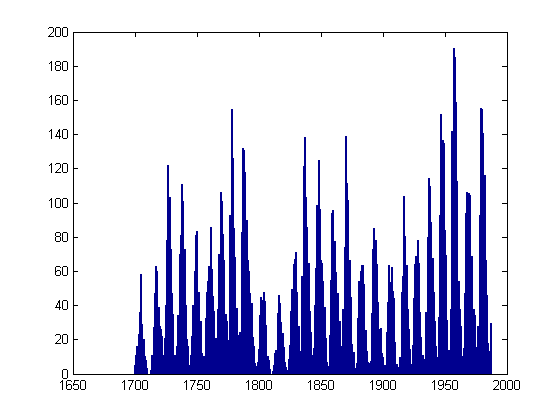
Show the data in a bar plot.
bar(year,spots)

Annotate the Year with the Maximum Number of Sunspots
[smax, indmax] = max(spots);The historical record shows the year
yearmax = year(indmax)
yearmax =
        1957
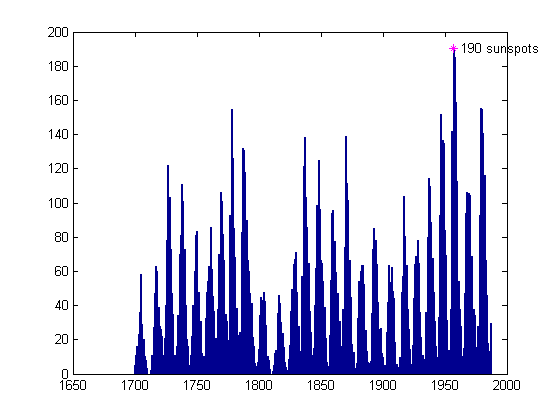
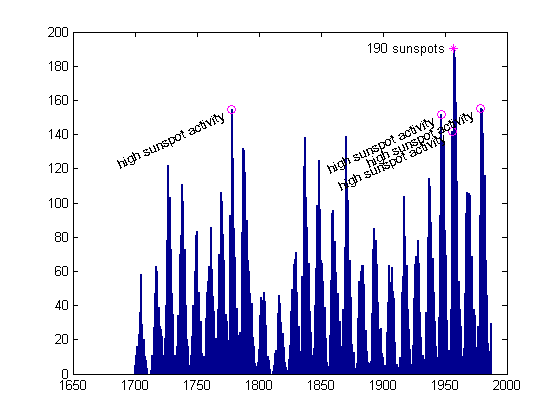
with the maximum number of sunspots, 190.
hold on
plot(yearmax, smax, 'm*')
hold off
ht = text(yearmax, smax,['  ',int2str(round(smax)), ' sunspots  ']);

Use Handle Graphics to Alter the Annotation Orientation
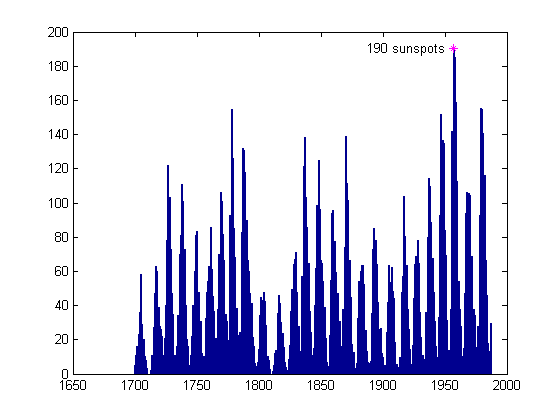
Let's try labeling the maximum so the label is right-justified now.set(ht,'HorizontalAlignment','right')
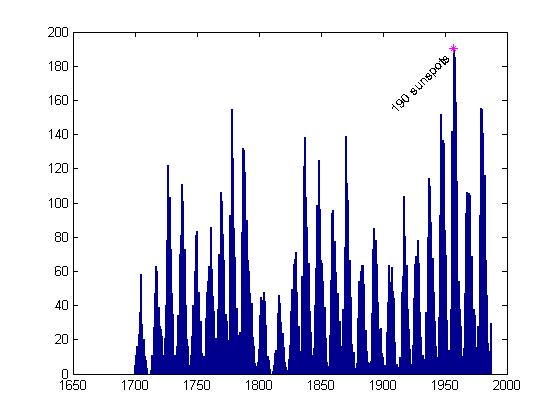
 Now change the label so it is at an angle, something I might want if I were planning to label several more points on the graph.
set(ht,'Rotation',45)

Note Other Maxima
The sunspot cycle has a periodicity of about 11 years. Let's see which other years have a high number of sunspots.[maxssa, indssa] = sort(spots,'descend');
year(indssa(1:10))
ans =
        1957
        1958
        1959
        1979
        1980
        1778
        1947
        1956
        1981
        1870
We see some years near the maximum year, 1957, then another cluster near 1979, and the next at 1778. Let me grab the first
five "distinct" clusters.
idxdistinct = [1 4 6 7 8];
year(indssa(idxdistinct))
ans =
        1957
        1979
        1778
        1947
        1956
Label Extra Peaks
Let's label these few other peaks in a similar manner to the first one.nearMaxYears = year(indssa(idxdistinct(2:end))) ssaMax = spots(indssa(idxdistinct(2:end))) hold on plot(nearMaxYears, ssaMax, 'mo') hold off hn = text(nearMaxYears, ssaMax,[' high sunspot activity '],... 'HorizontalAlignment','Right','Rotation',25); set(ht,'Rotation',0)
nearMaxYears =
        1979
        1778
        1947
        1956
ssaMax =
  155.4000
  154.4000
  151.6000
  141.7000

Write Around a Circle
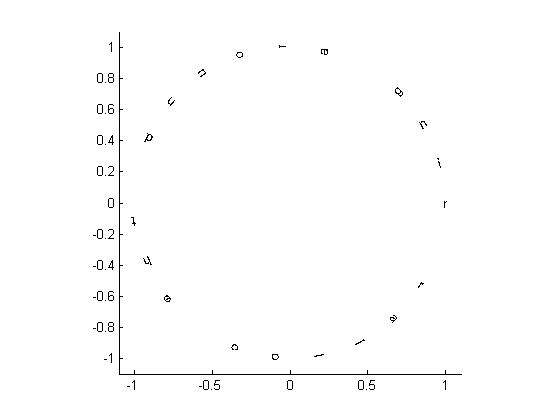
Just for fun now, let's write a phrase around a circle of radius 1.clf, box on phrase = 'ring around the collar '; num = length(phrase) angles = 0:(360/num):359; x = cos(angles*pi/180); y = sin(angles*pi/180); for ind = 1:length(phrase) text(x(ind),y(ind),phrase(ind),'Rotation',angles(ind),... 'HorizontalAlignment','center') end axis equal, axis([-1.1 1.1 -1.1 1.1])
num =
    23

References
There is a whole lot more you can do with text annotation in MATLAB. Here are some references for the language aspects of working with text. Though I don't want to turn this blog into one chiefly about graphics, I think I can cover some aspects here and still talk about it in terms of the language. Any suggestions? Please post them here. Published with MATLAB® 7.4- カテゴリ:
- Less Used Functionality





コメント
コメントを残すには、ここ をクリックして MathWorks アカウントにサインインするか新しい MathWorks アカウントを作成します。