
Treemap
Sean's pick this week is Treemap by Joe Hicklin.
Contents
Single Treemap
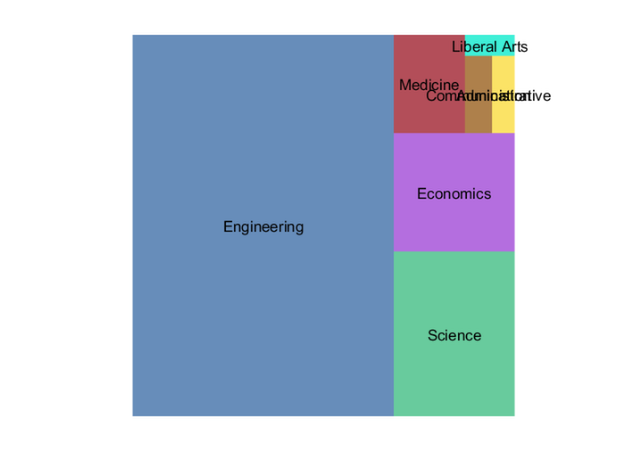
I've recently been working with one of our marketing teams to visualize where MATLAB is used across an organization or university based on department. One nice way to do this is with a treemap because it allows for hierarchical visualization. Let's take a look at a single layer treemap for a synthetic university. The data is stored in table called activations with variables College and Department.
collcounts = countcats(activations.College); % How many in each college?
r = treemap(collcounts); % Build tree rectangles
plotRectangles(r,categories(activations.College)) % Plot tree map
Hierarchical Treemap
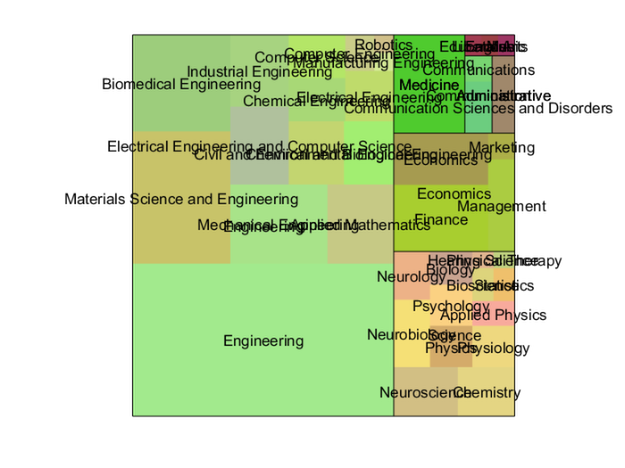
That looks pretty good, but it's just one layer. We also have information on the departments within a college. To include this, I will use the findgroups/splitapply workflow to split the departments based on their colleges.
% Which college
collegeidx = findgroups(activations.College);

% Count the number of activations in each department and bin by college
deptcounts = splitapply(@(x){nonzeros(countcats(x))},activations.Department,collegeidx);

% Keep the names for labeling
deptnames = splitapply(@(x){categories(removecats(x))},activations.Department,collegeidx);
Now we'll copy and modify Joe's example code to plug in my new data.
m = 39; % Department colors
for ii = 1:numel(deptcounts)
    colors = (3*repmat(rand(1,3),m,1) + rand(m,3))/4;
    rNew = treemap(deptcounts{ii}',r(3,ii),r(4,ii));
    rNew(1,:) = rNew(1,:) + r(1,ii);
    rNew(2,:) = rNew(2,:) + r(2,ii);
    plotRectangles(rNew,deptnames{ii},colors)
end

% Outline college boxes
outline(r)
Interactive Treemap
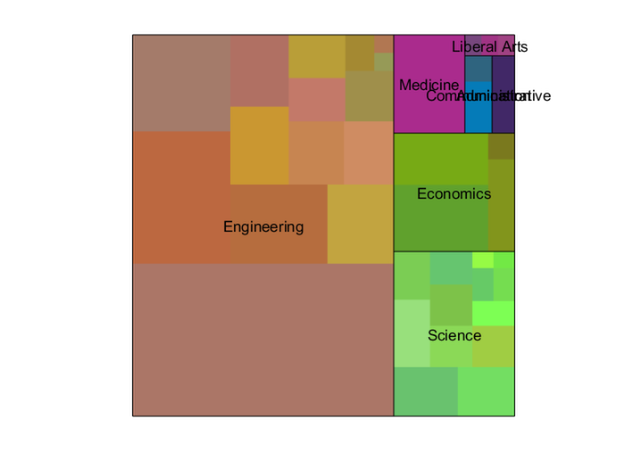
On my large monitor blown up that looks good. But it's kind of busy compressed. I'll enhance it to make it so that you can expand one school or "Drill down". First, repeat all of the above steps but leave the labels off the departments.
figure
plotRectangles(r,categories(activations.College));

for ii = 1:numel(deptcounts)
    colors = (3*repmat(rand(1,3),m,1) + rand(m,3))/4;
    rNew = treemap(deptcounts{ii}',r(3,ii),r(4,ii));
    rNew(1,:) = rNew(1,:) + r(1,ii);
    rNew(2,:) = rNew(2,:) + r(2,ii);
    plotRectangles(rNew,[],colors)
end
outline(r)
Second, I'll disable the ability for the patches to interact by turning off their 'HitTest' property.
patches = findall(gca,'Type','patch');
set(patches,'HitTest','off')
Finally, add a button down callback to the axes which calls my custom explode function.
function explodeBlock(evt,r,nsubs,sublabels)
% Blow up one block in a tree map

% Where was hit
xyhit = evt.IntersectionPoint(1:2);

% Which rectangle?
inx = xyhit(1) > r(1,:) & (xyhit(1) < r(1,:)+r(3,:));
iny = xyhit(2) > r(2,:) & (xyhit(2) < r(2,:)+r(4,:));
idx = inx & iny;

% Blow up that rectangle in new figure
rnew = treemap(nsubs{idx});
figure
plotRectangles(rnew,sublabels{idx})

end
set(gca,'Visible','on')
set(gca,'ButtonDownFcn',@(~,evt)explodeBlock(evt,r,deptcounts,deptnames))
Feedback
Using the treemap utility is pretty straight-forward and Joe has provided nice examples of all of the features. I do have a couple of enhancements though:
- plotRectangles and outline could return handles to the patches they create. This would allow me to skip the sloppy call to findobj that I have above.
- The text, as you probably noticed, tends to overlap a bit. It would be nice for the text to be jittered or rotated so as to avoid the collision.
Comments
Give it a try and let us know what you think here or leave a comment for Joe.
- Category:
- Picks


Comments
To leave a comment, please click here to sign in to your MathWorks Account or create a new one.