Costas arrays
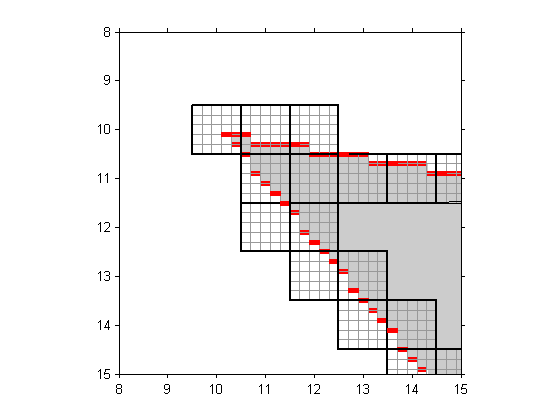
Last week I wrote about a possible modification to poly2mask that would estimate how much of each pixel is contained within a polygon. The idea was to use a regular 5-by-5 subgrid and count how many of the 25 subpixels are contained within the polygon. It would look something like this:

One of our graphics developers, Mike, sent me a note a couple of days later. He pointed out that using a regular N-by-N subsampling of the pixel doesn't do very well for polygon edges that are nearly vertical or horizontal. With a vertical or horizontal edge, your estimate of the pixel coverage is good only to within about 1/N instead of 1/N^2. As a possible alternative, Mike pointed me to something called a Costas array .
A Costas array is a permutation matrix. A permutation matrix contains 0s and 1s such that each row and each column contains only a single 1. The identity matrix is a trivial example:
eye(3)
ans =

     1     0     0
     0     1     0
     0     0     1
In addition to being a permutation matrix, a Costas array has the property that no pair of 1-valued elements has the same vector difference as any other pair. The 3-by-3 identity matrix above does not have this property. The vector difference between the (1,1) element and the (2,2) element is (1,1). This is the same as the vector difference between the (2,2) and (3,3) elements. Here's a visualization of a 10-by-10 Costas array:
v = [2 4 8 5 10 9 7 3 6 1];
n = 10;
plot(1:n, v, 'LineStyle', 'none', 'Marker', 'o', ...
    'MarkerEdgeColor', 'b', 'MarkerFaceColor', 'b')
axis equal
grid on
set(gca, ...
    'XTick', 0.5:(n+0.5), ...
    'YTick', 0.5:(n+0.5), ...
    'XLim', [0.5 (n+0.5)], ...
    'YLim', [0.5 (n+0.5)], ...
    'XTickLabel', '', ...
    'YTickLabel', '', ...
    'GridLineStyle', '-')

And here's a 29-by-29 example:
v = [3 21 23 22 8 15 26 6 16 11 28 5 2 18 10 14 12 13 27 20 9 29 19 ...
    24 7 1 4 17 25];
n = 29;
plot(1:n, v, 'LineStyle', 'none', 'Marker', 'o', ...
    'MarkerEdgeColor', 'b', 'MarkerFaceColor', 'b')
axis equal
grid on
set(gca, ...
    'XTick', 0.5:(n+0.5), ...
    'YTick', 0.5:(n+0.5), ...
    'XLim', [0.5 (n+0.5)], ...
    'YLim', [0.5 (n+0.5)], ...
    'XTickLabel', '', ...
    'YTickLabel', '', ...
    'GridLineStyle', '-')

Using the same basic procedure I described last time, you could count how many of the 29 dots lie within the polygon and then divide by 29 to get your coverage estimate.
There are many possible variations on this technique, and Mike assures me that it is an active area of research in computer graphics.
Costas arrays were originally described in the context of waveform detection. See J. Costas, "A Study of a Class of Detection Waveforms Having Nearly Ideal Range-Doppler Ambiguity Properties," Proceedings of the IEEE, vol. 72, no. 8, August 1984.


コメント
コメントを残すには、ここ をクリックして MathWorks アカウントにサインインするか新しい MathWorks アカウントを作成します。