 Cleve’s Corner: Cleve Moler on Mathematics and Computing
 The MATLAB Blog
 Guy on Simulink
 MATLAB Community
 Artificial Intelligence
 Developer Zone
 Stuart’s MATLAB Videos
 Behind the Headlines
 File Exchange Pick of the Week
 Hans on IoT
 Student Lounge
 MATLAB ユーザーコミュニティー
 Startups, Accelerators, & Entrepreneurs
 Autonomous Systems
 Quantitative Finance
 MATLAB Graphics and App Building
Pokémon Go meets MATLAB
Until about two weeks ago, I had given absolutely no thought to the possibility of a relationship between MATLAB and Pokémon Go, this summer's worldwide mobile gaming phenomenon. But then I heard about someone using some basic image processing techniques to hack the game by automating the search for PokéStops.
Well, I don't play Pokémon Go and I don't know what a PokéStop is, but I understood the basic idea behind the search automation.
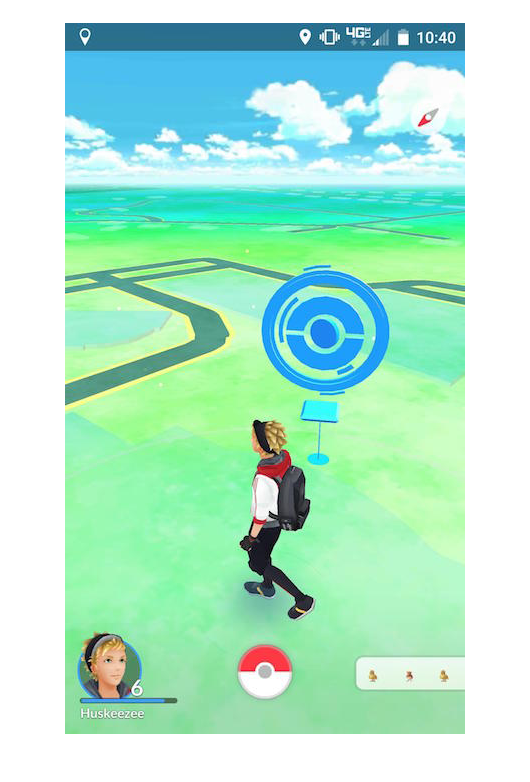
Here is a screen shot from the game.
url = 'https://blogs.mathworks.com/steve/files/pokemon-go-screen.jpg';
rgb = imread(url);
imshow(rgb)
(Thanks very much to the people who sent me screen shots, especially Haripriya and Chris.)
That geometric pattern of nested blue circles is a PokéStop. Our task is to find those. I'm going to show the basic outline of a solution with these steps:
1. Segment the image by color.
2. Clean up the segmentation using a morphological closing.
3. Compute the areas and centroids of the connected components in the segmentation.
4. Choose the largest object.
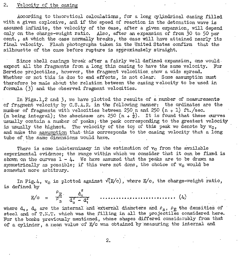
To get a quick idea of how to segment the image by color, I like to use the Color Thresholder, usually with the Lab color space. Here's a screen shot that shows how I have adjusted the a* and b* sliders to pick out the range of colors associated with the PokéStop.

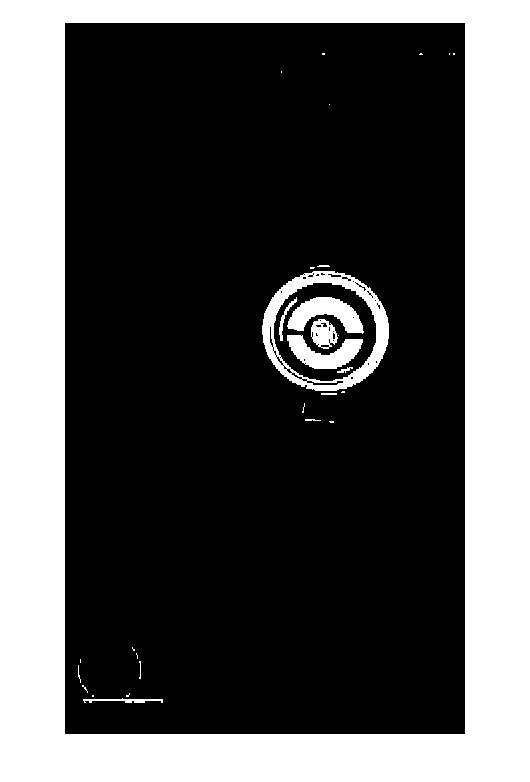
Here's the resulting mask that I saved from the Color Thresholder.
imshow(BW)
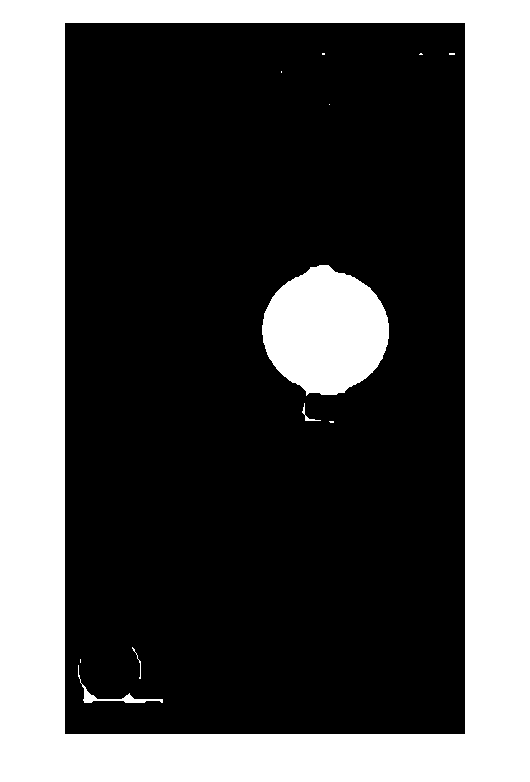
Now let's use morphological closing to turn the PokéStop pattern into a single, connected blob.
BW2 = imclose(BW,strel('disk',20));
imshow(BW2)
Next, use regionprops to find all the connected components and compute their areas and centroids. In recent versions of the Image Processing Toolbox, you can tell regionprops to return the result as a table, which makes the results easier to read.
t = regionprops('table',BW2,'area','centroid')
t =

    Area         Centroid
    _____    ________________

     1157     37.43    665.14
    13259    260.56    313.99
        2       217      49.5
        6       259      31.5
        1       265        82
        6     356.5    31.667
       12     387.5      31.5
Finally, identify the table row with the biggest area, and get the corresponding centroid.
[~,j] = max(t.Area);
location = t.Centroid(j,:)
location =

  260.5581  313.9893
Let's see how well that worked by superimposing the location on the original image.
imshow(rgb)
hold on
plot(location(1),location(2),'dy','MarkerSize',10,'MarkerFaceColor','y')
hold off

There you go.
Catch 'em all!


Comments
To leave a comment, please click here to sign in to your MathWorks Account or create a new one.