
The typical modern French* horn, pictured below, has about 23 total feet of tubing. At the beginning and the end, the tubing is conical. In the middle, the tubing is cylindrical.Depending on which... 더 읽어보기 >>

Note
Steve on Image Processing with MATLAB has been archived and will not be updated.
The typical modern French* horn, pictured below, has about 23 total feet of tubing. At the beginning and the end, the tubing is conical. In the middle, the tubing is cylindrical.Depending on which... 더 읽어보기 >>


A question on MATLAB Answers caught my eye earlier today. Borys has this pseudocolor image of a weighted adjacency matrix: And he has this image of the color scale: Borys wants to know how to compute... 더 읽어보기 >>

I wrote previously about the new colorChecker, which can detect X-Rite test charts in the R2020b release. Another area of new color-related functionality is computing perceptual color differences.... 더 읽어보기 >>
Lately, I've been spending more time on MATLAB Central, and I'd like to encourage you to try out some of the resources there, if you haven't already.Have you heard of Cody? It is an addictive MATLAB... 더 읽어보기 >>
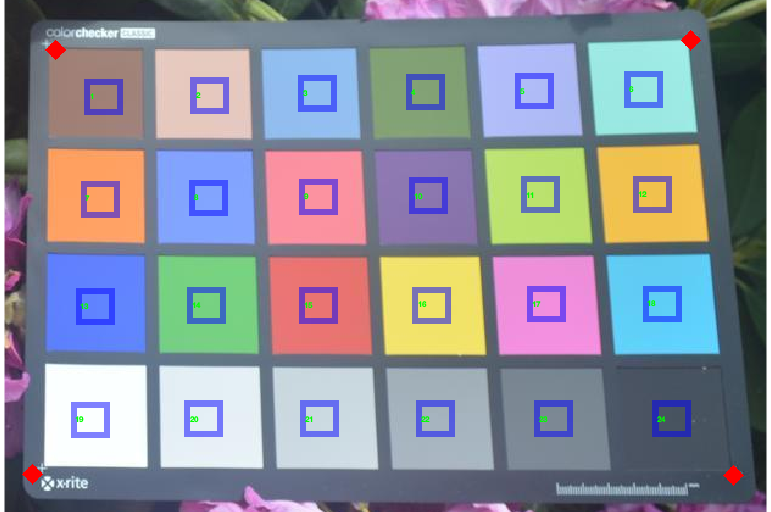
When I saw this picture, I was really tempted to take it into the local garden nursery and ask them how to keep color checker charts out of my rhododendrons. No, no, this post is not really about... 더 읽어보기 >>

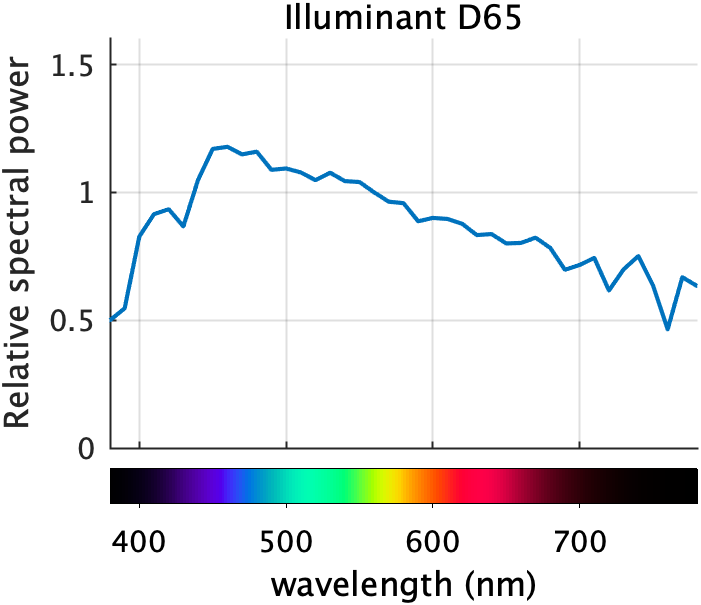
Recently, I've been explaining how I made this plot, which is from DIPUM3E (Digital Image Processing Using MATLAB, 3rd ed.): In my July 20 post, I showed one way to compute the spectral colors to... 더 읽어보기 >>

I was looking at these two numbers the other day:$0.01$$\frac{5764607523034235}{576460752303423488}$It turns out they are very close, differing only by about 5 parts in a quadrillion.A tech support... 더 읽어보기 >>

It was a while ago now, but on April 27 I started explaining how I made this plot, which is from DIPUM3E (Digital Image Processing Using MATLAB, 3rd ed.):... 더 읽어보기 >>
The new edition of Digital Image Processing Using MATLAB (DIPUM3E) contains a number of MATLAB functions related to color, color calculations, and color visualization. I wrote about functions for... 더 읽어보기 >>

I like to think of geometric transformations of images (stretching, shrinking, rotating, etc.) by starting with the geometric transformations of points. You could think of a geometric point... 더 읽어보기 >>