
Transforming a color image to a weighted adjacency matrix
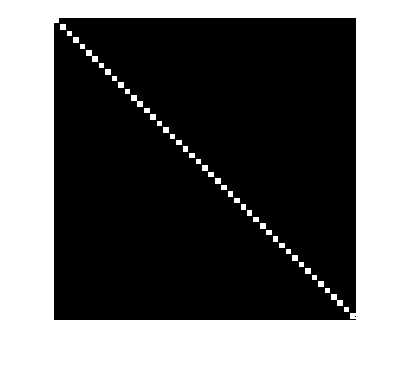
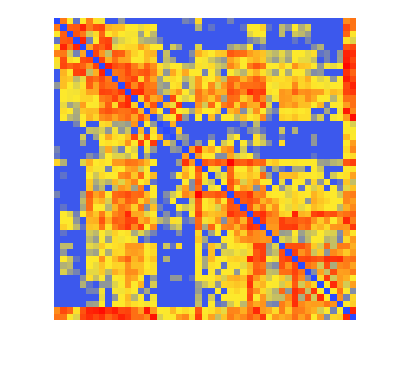
A question on MATLAB Answers caught my eye earlier today. Borys has this pseudocolor image of a weighted adjacency matrix:

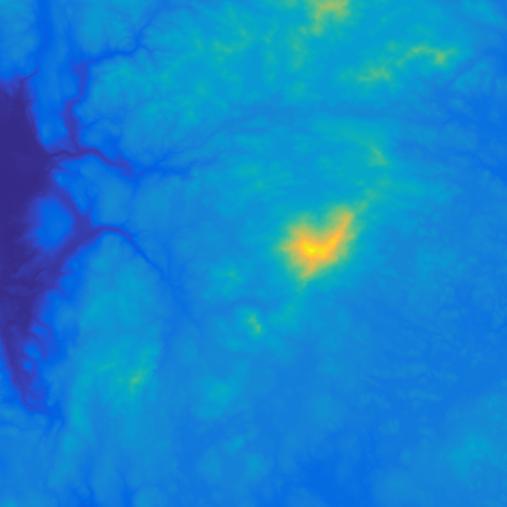
And he has this image of the color scale:

Borys wants to know how to compute the real adjacency matrix from this image, knowing that the color scale represents the range [0,5].
The problem looked interesting to me, and I wanted to give it a try.
image_url = "https://www.mathworks.com/matlabcentral/answers/uploaded_files/410520/image.png";
scale_url = "https://www.mathworks.com/matlabcentral/answers/uploaded_files/410525/image.png";

A = imread(image_url);
Here is my planned approach:
1. Use the white squares to determine the grid of coordinates for the cells of the adjacency matrix.
2. Extract the colors from the locations found in step 1.
3. For each extracted color, find the minimum color difference betweent that color and the colors in the scale.
4. Use linear interpolation to determine the weight value (between 0 and 5) for the corresponding adjacency matrix cell.
The first thing I did was to use the Pixel Region tool to check if the white squares are exactly white ([255,255,255]).
imshow(A)
impixelregion
![]()
And they are.
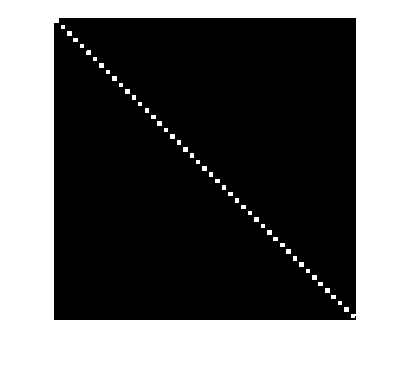
Next, I'm going to compute a mask image corresponding to just the white squares.
mask = all(rgb == reshape([255 255 255],1,1,3),3);
imshow(mask)
At a quick glance, it appears that the white squares aren't touching each other, but just to sure, let's erode them a bit.
mask2 = imerode(mask,ones(3,3));
imshow(mask2)
Now, let's find the center of each white square.
T = regionprops("table",mask2,"Centroid");
head(T)
ans =

  8×1 table

        Centroid
    ________________

       5.5       5.5
        19        19
        32        32
      44.5        45
      57.5      57.5
    70.545    70.545
        83        83
        96        96
Round the centroid coordinates to integer locations.
m = round(T.Centroid(:,2));
n = round(T.Centroid(:,1));
Let's double-check our locations
figure
imshow(A)
axis([n(1) n(6) m(1) m(6)])
hold on
for q = 2:5
    for r = 2:5
        x = n(r);
        y = m(q);
        plot(x,y,"o","MarkerFaceColor","w","MarkerEdgeColor","k")
        text(x,y,"(" + q + "," + r + ")",...
            "HorizontalAlignment","center",...
            "VerticalAlignment","bottom")
    end
end
hold off

That looks good. Now, let's extract one of the colors and match it to a location on the scale.
Read the scale image and change it into an Mx3 matrix of color values.
scale = imread(scale_url);
scale = scale(1,:,:);
scale = reshape(scale,[],3);
Grab the color in the (5,3) cell of the adjacency matrix image.
c = A(m(5),n(3),:);
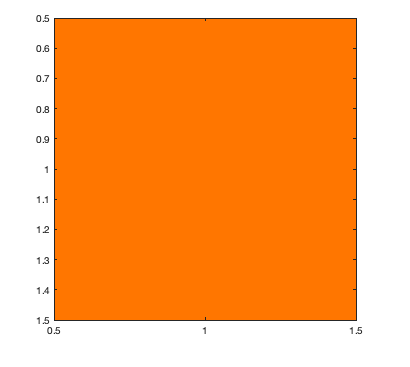
Display the color
image(c)
Now find the closest match in the color scale. I'll use deltaE, which I described in my 30-Oct-2020 post.
c = reshape(c,1,3);
D = deltaE(repmat(c,size(scale,1),1), scale);
Let's double-check our work at this point. I'm expecting there to be a clear minimum, which identifies the closest color on the scale. Is that the case?
plot(D)
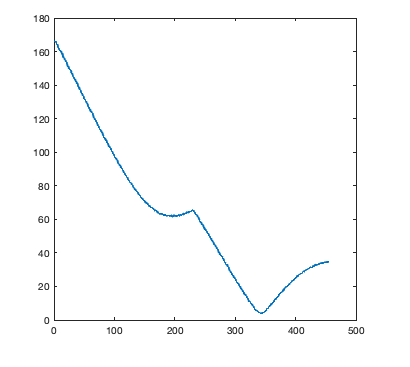
That looks good.
What is the minimum value of D, and where does it occur?
[D_min,idx] = min(D);
D_min
D_min =

  single

    3.9335
idx
idx =

   341
Now we can use interpolation to get the adjacency cell weight for this cell. Recall that the weights range from 0 to 5.
w = interp1([1 size(scale,1)], [0 5], idx)
w =

    3.7363
We have all the pieces of the computation. Now, let's figure out the weight for every cell.
for q = 1:length(m)
    for r = 1:length(n)
        % Skip the cells on the diagonal.
        if q ~= r
            c = A(m(q),n(r),:);
            c = reshape(c,1,3);
            c = repmat(c,size(scale,1),1);
            D = deltaE(c,scale);
            [D_min,idx] = min(D);
            Aw(q,r) = interp1([1 size(scale,1)],[0 5],idx);
        end
    end
end
Finally, we can display our computed weighted adjacency matrix. Except for the diagonal elements, which will display as blue using this procedure, it should look very similar to the image we started with.
imshow(Aw,[])
colormap(scale)
That was fun!


Comments
To leave a comment, please click here to sign in to your MathWorks Account or create a new one.