Detecting Kelp Forests through Deep Learning
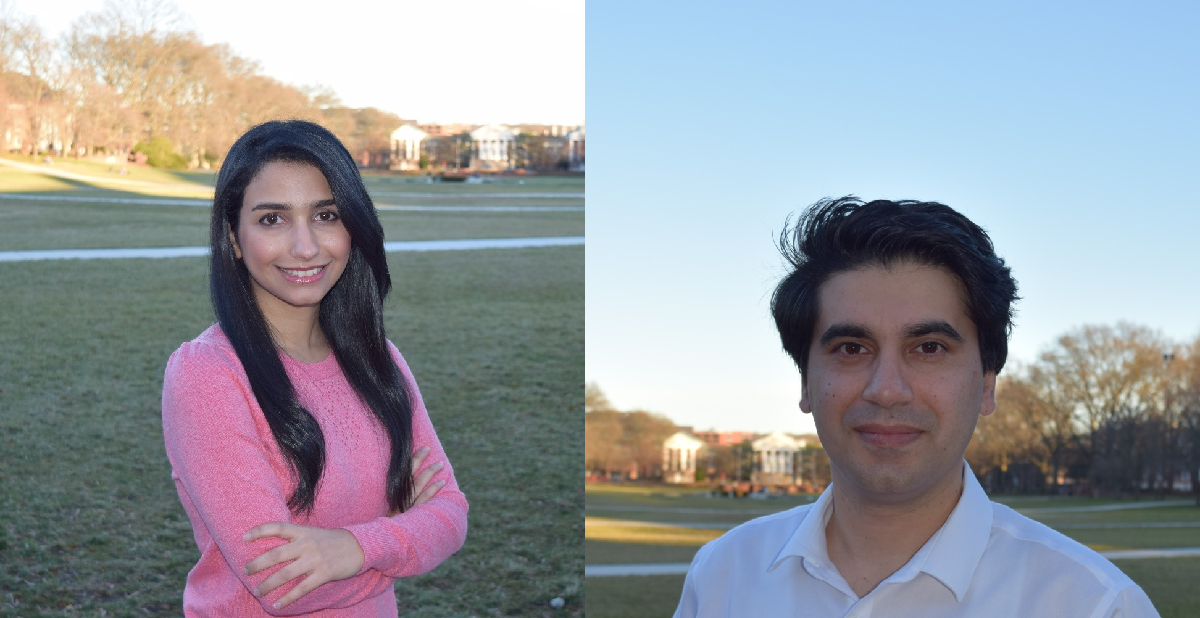
Joining us today is Kaveh Faraji and Azin Al Kajbaf, who won the Top MATLAB User award for the Kelp Wanted competition, which challenged participants to use AI to identify kelp canopies based on satellite imagery. Over to you guys!
Introduction to the Team

Azin earned her Ph.D. in Civil Engineering from the University of Maryland in 2022 and currently serves as a postdoctoral researcher at Johns Hopkins University and the National Institute of Standards and Technology (NIST). Kaveh is a Ph.D. candidate in Civil Engineering at the University of Maryland. Our academic pursuits revolve around the utilization of machine learning, deep learning, geospatial analysis, and statistical methodologies in the assessment of natural hazards.
We have been using MATLAB in our research since starting our PhD programs focusing primarily on machine learning and statistical analysis tools. We becameinterested in the application of deep learning in our research and were looking to get hands-on experience with MATLAB’s Deep Learning Toolbox. This opportunity was provided by MathWorks when they sponsored a deep learning competition a few years back. Since then, we have participated in several deep learning competitions and won multiple awards. We are also actively using machine and deep learning methods in our research projects.
Breaking down the problem
The goal of this competition is to utilize satellite imagery to identifythe kelp canopy. Therefore, the competition requires a semantic segmentation of images. The predictors are the satellite images,which include five bands (SWIR, NIR, Red, Green, and Blue) from Level 2 Landsat products, a binary cloud mask band, and a digital elevation map from ASTER.An algorithm needs to be used to determine whether kelp canopies are present in each pixel of the images.
How did we implement it?
Our solution containsfour steps. We developed multiple models and obtained our final answer from the ensemble of those.
- We loaded the images using “imageDatastore” and a custom reading function. To process the data, we used a threshold to adjust the values of outlier pixels. We also used Z-score to normalize images. We employed different strategies to divide the data into training and validation sets.
- The second step is building a model for semantic segmentation of satellite images. There are several machine learning approaches for segmentation. For this purpose, we used MATLAB’s Deep Learning Toolbox and developed a U-Net1 structure, which is are powerful tool to classify image pixels in semantic segmentation tasks. We used different networkstructures with different encoder depths and dropout ratios.
- For the loss layer, we used several loss functions and their combinations. The loss functions that we used include dice loss, squared dice loss, focal loss, and a combination of dice and focal loss functions.
- To train the network, we used “Adam solver“withan initial learning rate of 0.0002, which drops every 50 epochs. The network would train for 200 epochs, and the best model is selected based on the validation loss. We trained 19 U-Net networks with different structures, loss functions, and preprocessing strategies. Ultimately, we used the average of these 19 models to obtain the best result.
Results
As explained, our best score is the result of using an ensemble of 19 models. The following image demonstrates our framework and final score based on the Dice coefficient.

Key Takeaways
The Deep Learning Toolbox is user-friendly. Building the U-Net structure was straightforward, and we were able to create different loss functions and combine them easily. For this competition, we had to develop several models and implement multiple strategies to enhance the accuracy incrementally. The most important steps that led to obtaining the best results were using combined loss functions and preprocessing and dividing strategies used for deep learning. Given more time, we would explore other approaches (1-D CNN and boosting trees) to label pixels and provide the predicted labels as input together with other bands for our U-Net structures. We think using this strategy will help us reduce the number of models in the ensemble.
- Category:
- deep learning


Comments
To leave a comment, please click here to sign in to your MathWorks Account or create a new one.