
Focused on Zooming
I'd like to welcome guest blogger Dan Sternberg from the Plotting and Exploration team. Dan will occasionally be blogging here on the Inside the MATLAB Desktop blog.
Zooming in figures has been around forever. There are a couple of neat zoom enhancements, though, that may have snuck in under
your radar (you didn't read the release notes?!). Between MATLAB 7.0 (R14) and MATLAB 7.3 (R2006b) we added the ability to link
two axes, constrain a zoom and customize a zoom. Here are a few examples to help you get started.
 To enter zoom mode, I can click on the toolbar button shaped like a magnifying glass.
 Alternatively, I can enter the mode from the command-line.
 For the purposes of this posting, whenever I wish to zoom, I'll do so programatically, and by a factor of two.
 I can now link these two axes
 From this point onwards, if the limits of one x-axis change (perhaps due to a zoom operation), the limits of the second axes
will follow.
From this point onwards, if the limits of one x-axis change (perhaps due to a zoom operation), the limits of the second axes
will follow.
 Using the zoom object, I am also able to prevent an axes from being zoomed or have it only zoom in a particular direction.
 The code to the "overviewPlot" function can be found on the File Exchange here.
Similar features exist for the "pan" and "rotate3d" functions. What sorts of customizations would you like to be able to
accomplish using these tools?
Here's a video that demonstrates how to use the overviewPlot function. Thanks to Doug (of Doug's Pick of the Week) for recording this.
-by Dan Sternberg, The MathWorks
This blog entry was written using the MATLAB publishing feature.
The code to the "overviewPlot" function can be found on the File Exchange here.
Similar features exist for the "pan" and "rotate3d" functions. What sorts of customizations would you like to be able to
accomplish using these tools?
Here's a video that demonstrates how to use the overviewPlot function. Thanks to Doug (of Doug's Pick of the Week) for recording this.
-by Dan Sternberg, The MathWorks
This blog entry was written using the MATLAB publishing feature.
Contents
Zooming an Axes
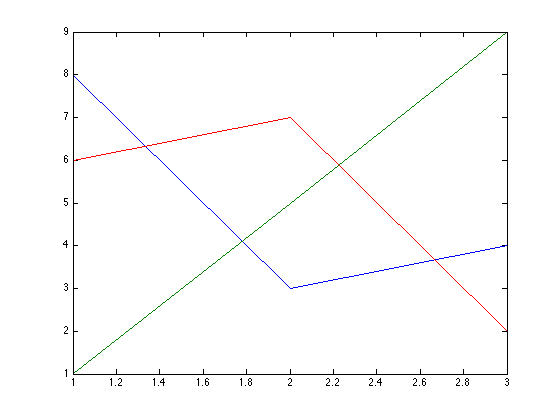
We'll start by plotting some data. I'll use one of my favorite data sets, the magic square:ax = axes; p = plot(ax,magic(3));
To enter zoom mode, I can click on the toolbar button shaped like a magnifying glass.
Alternatively, I can enter the mode from the command-line.
zoom on;
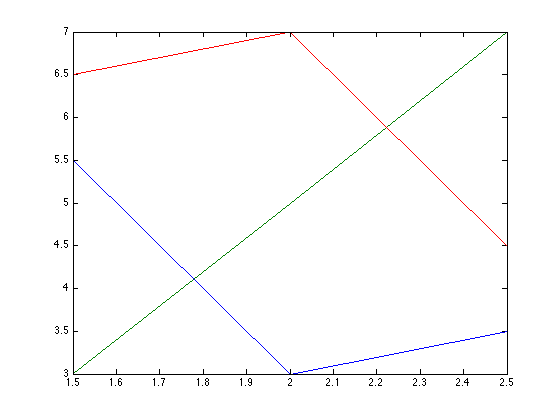
For the purposes of this posting, whenever I wish to zoom, I'll do so programatically, and by a factor of two.
zoom(2);
Linking two Axes
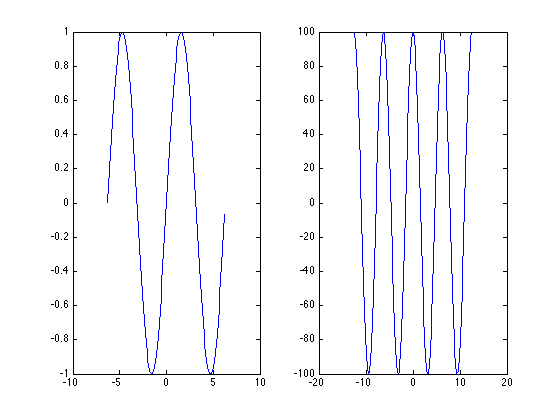
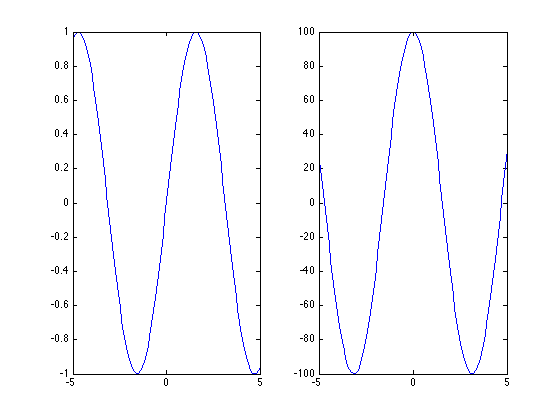
Simply using the zoom tool, I am able to explore a data set that exists in a single axes. You might ask, however, "What if I have two subplots with data that is related? If I zoom in on one plot, can I have the other one follow suit?" That's an excellent question. I'm glad you asked. Let's create two sequences of data that share a domain, but but live in different ranges.x1 = -2*pi:0.1:2*pi; y1 = sin(x1); x2 = -4*pi:0.1:4*pi; y2 = cos(x2)*100; ax(1) = subplot(1,2,1); plot(ax(1),x1,y1); ax(2) = subplot(1,2,2); plot(ax(2),x2,y2);
I can now link these two axes
linkaxes(ax,'x');
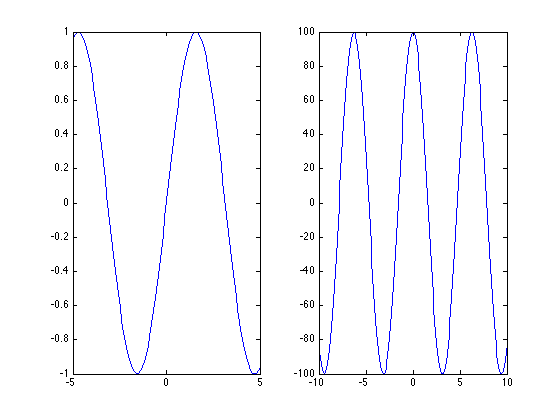
From this point onwards, if the limits of one x-axis change (perhaps due to a zoom operation), the limits of the second axes
will follow.
Constraining the Zoom
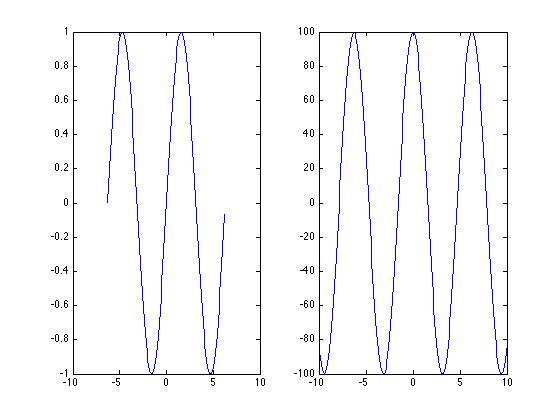
In addition to linking axes, we can also constrain the zoom direction. For example, I may not want to zoom the y-axis of either one of my subplots.zoom xon;
zoom(2);
Customizing the Zoom
It may happen, however, that the two data sets I've plotted do not share a domain or range, but are correlated in some way. In this case, I need to do a bit more work to build a relationship. Let's begin by getting the zoom object for the figure.hZoom = zoom(gcf); get(hZoom)
      ButtonDownFilter: []
     ActionPreCallback: []
    ActionPostCallback: []
                Enable: 'on'
          FigureHandle: [1x1 figure]
                Motion: 'horizontal'
             Direction: 'in'
      RightClickAction: 'PostContextMenu'
         UIContextMenu: []
From this object, we can get some information about the state of the figure. For example, we see that zoom mode is on, and
constrained to be horizontal (x-only).
There are also callbacks that may help us further customizing the zoom behavior of these two axes. When the axes were linked,
I lost some information in the second axes. I would much prefer that the second axes zooms twice as much as the first and
the first zooms half as much as the second. To enforce this relationship, I can use the "ActionPostCallback" property of the
object.
set(hZoom,'ActionPostCallback',{@halfZoom,ax});
dbtype halfZoom.m
1     function halfZoom(fig,evd,ax) %#ok<INUSL>
2     % Zoom one axes by a factor of two from the other:
3
4     currentAxes = evd.Axes;
5     if currentAxes == ax(1)
6         % If we are zooming the left axes, zoom the right axes by twice as
7         % much:
8         newLim = get(currentAxes,'XLim');
9         set(ax(2),'XLim',newLim*2);
10    else
11        % If we are zooming the right axes, zoom the left axes by half as much:
12        newLim = get(currentAxes,'XLim');
13        set(ax(1),'XLim',newLim/2);
14    end
The event data of the callback tells me which axes I've zoomed in on. From there, I can obtain the axes limits and perform the necessary calculations to enforce this relationship.
linkaxes(ax,'off');
set(ax,'XLimMode','auto');
zoom(2);
Using the zoom object, I am also able to prevent an axes from being zoomed or have it only zoom in a particular direction.
setAllowAxesZoom(hZoom,ax,false);At this point, there will be no change to the figure if I attempt to zoom in either axes.
Using Zoom in a Custom Application
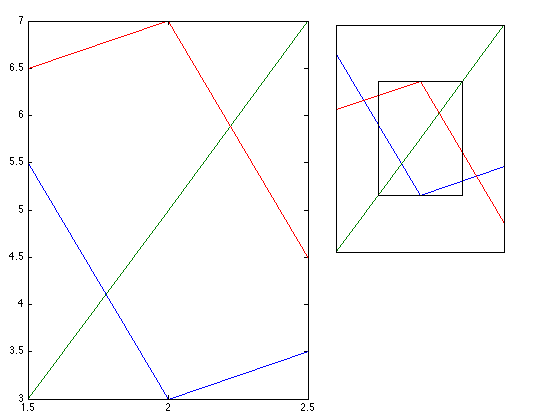
Using the zoom object, it is now possible to take advantage of zooming behavior in a custom application. For example, we can construct a figure containing an overview axes. Whenever I zoom in on the main axes, I am able to see where I am in my data.overviewPlot(gcf,magic(3)); set(gcf,'Color','w'); zoom on; zoom(2);
The code to the "overviewPlot" function can be found on the File Exchange here.
Similar features exist for the "pan" and "rotate3d" functions. What sorts of customizations would you like to be able to
accomplish using these tools?
Here's a video that demonstrates how to use the overviewPlot function. Thanks to Doug (of Doug's Pick of the Week) for recording this.
-by Dan Sternberg, The MathWorks
This blog entry was written using the MATLAB publishing feature.
- Category:
- Data Tools


Comments
To leave a comment, please click here to sign in to your MathWorks Account or create a new one.