Reader JP asked me about my recent blog post on the Hough transform. Specifically, she wanted to know exactly how the rho-theta coordinate system was defined. When I answered her question, I realized that our documentation isn't very clear on this point, so I thought I'd post the answer here.
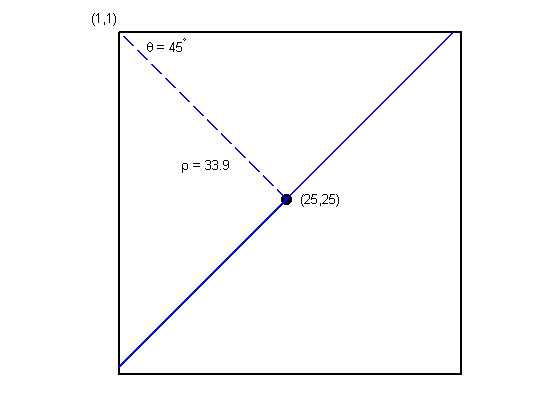
Suppose you have a pixel at (x=25, y=25). (Note that the Image Processing Toolbox convention is that the x-axis is the horizontal axis, the y-axis is the vertical axis, and the origin is at the upper left.) There is a family of lines that all go through (25,25). The solid blue line in the diagram below is one such line. Draw a perpendicular projection from the upper left pixel to the line; that's the dashed blue line below. The length of the projection is rho. The clockwise angle between the projection and the horizontal axis is theta.
x = [1 50 50 1 1]; y = [1 1 50 50 1]; plot(x,y,'k','LineWidth',2,'Clipping','off') axis equal axis ij axis off hold on plot(25,25,'k','Marker','o','MarkerSize',8,'MarkerFaceColor','k') plot([1 25], [1 25], 'b', 'LineWidth', 2, 'LineStyle', '--') plot([1 49], [49 1], 'b', 'LineWidth', 2) text(10,20,'\rho = 33.9') text(5,3,'\theta = 45^\circ') text(27,25,'(25,25)') text(-3,-1,'(1,1)') hold off
Let's try this with an image.
a = zeros(50,50); a(25,25) = 1; [H, theta, rho] = hough(a); imshow(H, [], 'XData', theta, 'YData', rho, 'InitialMag', 'fit'); axis on xlabel('\theta') ylabel('\rho')
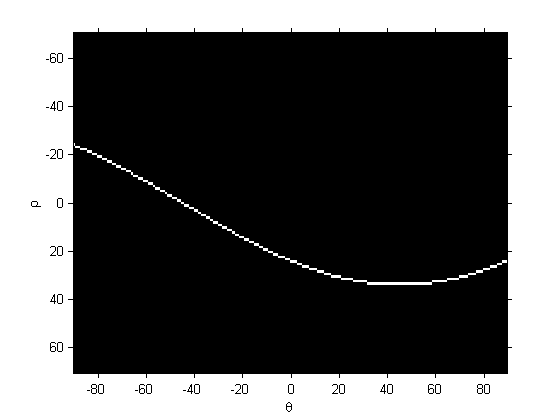
Zooming in around the theta = 0 point gives us this:
axis([-5 5 21 26])
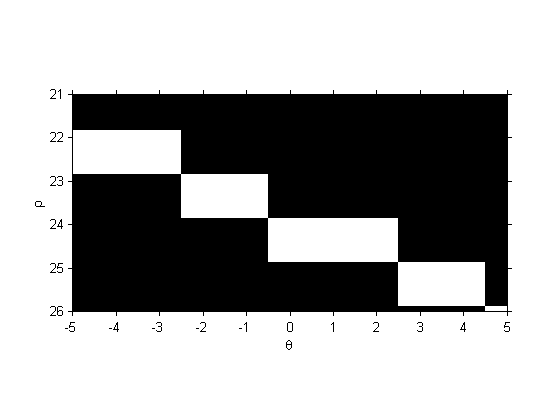
There is a vertical line (theta = 0 degrees) that goes through the (25,25) pixel, and this line is 24 units away (perpendicular distance) from the upper left pixel.
Let's look at another spot.
axis([71 79 27 33])
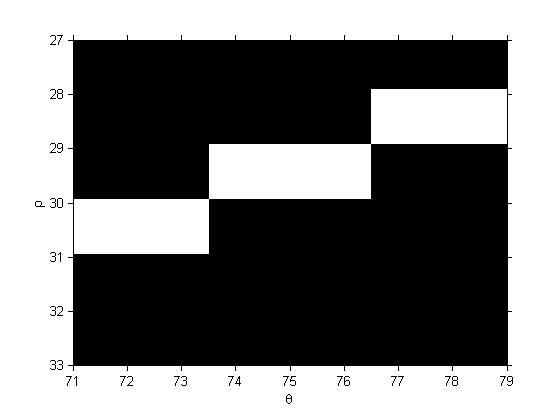
There is another line through (25,25) whose perpendicular projection from (1,1) is 75 degrees from the horizontal axis. The length of perpendicular projection to this line from (1,1) is about 29 units.
That's about it. I'll ask our writer to add more information about the Hough transform coordinate system to the Users Guide.
(Note: The coordinate systems shown in Digital Image Processing by Gonzalez and Woods, as well as Digital Image Processing Using MATLAB by Gonzalez, Woods, and Eddins, are different from what I've shown here. In those sources, the x-axis is the vertical axis.)
Get
the MATLAB code
Published with MATLAB® 7.3


can you please explain more about rectangular or building detection using hough transfom.
Alaa – I’ve never implemented a rectangle detector myself, so I don’t have information readily at hand to give you. However, there appear to be many papers on the subject on the Web.
how it is useful in lane tracking for autonomous vehicle
Sreenivas Mekala,
I tried hough transform to detect the lane.
but the problem here is, it also detects the road edges.
And some times the broken lane in the middle of road is not detected.
do u have any idea to overcome that.
regards
manimekalai
Hi Steve,
We are interested in finding lines that go through spots of generated data. However, the data is plotted in log-log and thus the spacing between the points is not equal. This throws Hough off. What we would like to do is add weights to the points so that the Hough doesn’t ignore the first points of our data (widely spaced).
Any ideas how to do this?
We don’t quite know how to go ‘into’ a mex file to do this.
Thanks,
Daphne
Daphne—The hough function doesn’t “ignore” any points. You might want to look at the ‘FillGap’ optional parameter for the houghlines function.
Hi Steve,
I’d like to clarify Daphne’s previous post: we have a set of data points which we are trying to fit straight lines to. We don’t directly use linear regression like polyfit and etc, because we want this to be an automatic procedure and there is no prior knowledge regarding the amount of lines and their end points. We thought we could use Hough to detect the lines and end points, however because the data set is in a logarithmic scale – some lines are formed by a large amount of points and some lines are formed by a small number of points. Lowering the threshold isn’t enough because data is noisy. That is why we were thinking of adding a query to the Hough function such that certain data points will have a larger weight – more votes in the relevant accumulator bins.
Do you think there is a way to do this without getting into the built-in Hough function?
Thanks,
Yael
Yael—I think I understand now. You can find an M-file implementation of hough in the book Digital Image Processing Using MATLAB. You should be able to take that code and modify it to weight pixels’ contributions to the accumulator array. Note: that code was written before the function accumarray was added to MATLAB. If I were writing that function today as an M-file, I’d use accumarray.
how to detect rectangle in specific portion of an image using hough transform
Ashok—The basic Hough transform is for detecting lines, not rectangles, so you’ll have to do some algorithm development work in order to determine whether the detected lines form are rectangle. Try doing some searches on “rectangle detection” to get some ideas.
After generating the H for a binary image and summing the value of rho across the theta axis, (i.e., summing the columns of the array), I found that the value of sum of rho for each theta are the same. I can’t figure out why is that so. Thanks!
WC—For each theta value, every foreground pixel gets assigned to exactly one accumulator bin in the corresponding rho column. Therefore, the column sum of the accumulator array H is simply the number of foreground pixels in the input image.
i have a binary image containing some lines. want to find longest line of all. how to perform pixel calculations on maatrix?
Ashok—You might find the hough, houghpeaks, and houghlines functions to be useful.
hello
can this hough transform be used for an irregular image for which the edges are obtained?
Rajkumar—What do you mean by “irregular image”?
I use Hough Transform For Circle Detection – with unknown radius, if I use a loop to do so, it takes long time. Can you help me, to Pre-allocate memory for the Hough Matrix and other variables. if The ‘R’ is known in the range from 1 to 50,so we can reserve 50 “layers” for the HM matrix.Please
If you want me to send the code for HT, just let me know,
Thank you……..
Hi Steve,
I am looking to see if a parabola can be detected using Hough transform where there are missing segments, plus the image is very low signal-to-noise. Thanks
TG—I don’t know. I’ve never tried it.