
Relabeling a label matrix
The three most common questions I've been hearing about bwlabel, which is used for labeling connected components in a binary image, are about
- Search order
- Relabeling (renumbering the label matrix)
- Correspondence between labels in two different images
Today I'll tackle relabeling.
In my previous post on search order, I showed how to postprocess the labeled objects to modify their order according to various criteria. Now I'll take that a step further and use the sorted output from regionprops to renumber the labels in the label matrix.
Blog reader Trung wanted to know if we could sort lexicographically by centroid, so I'll do that here.
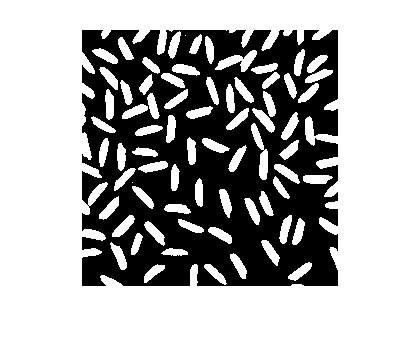
url = 'https://blogs.mathworks.com/images/steve/186/scanned_page.png';
bw = imread(url);
bw = ~bw(1107:1194, 17:135);
imshow(bw, 'InitialMagnification', 'fit')

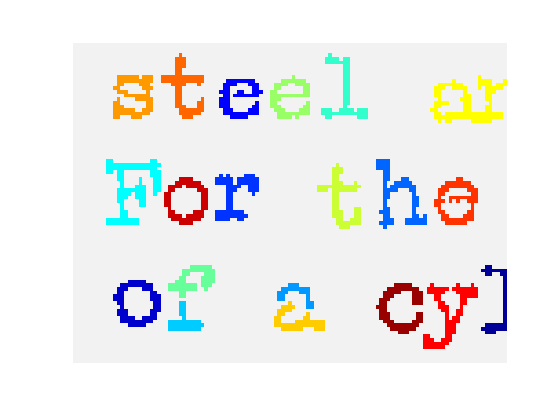
Here's a false-color view of the label matrix using label2rgb:
L = bwlabel(bw);
rgb = label2rgb(L, 'jet', [.95 .95 .95], 'shuffle');
imshow(rgb, 'InitialMagnification', 'fit')
Now let's use regionprops to get the centroids for each object. To facilitate the relabeling step, I'll get the 'PixelIdxList' for each object.
s = regionprops(L, {'Centroid', 'PixelIdxList'});Next, sort lexicographically by the centroids, sorting first by the vertical coordinate.
centroids = cat(1, s.Centroid);
[sorted_centroids, sort_order] = sortrows(fliplr(centroids));
s2 = s(sort_order);
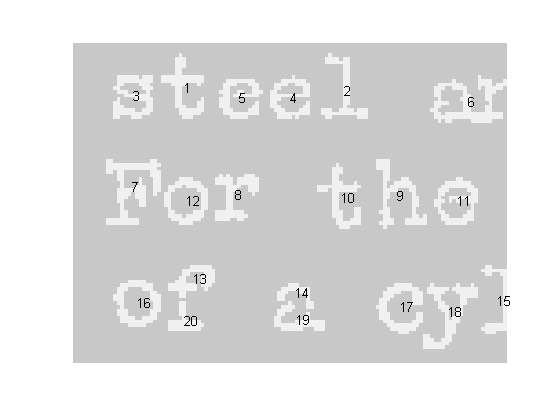
To visualize the sorted object order, we can display the object numbers on top of the objects like this:
% First, make an image with a light gray background instead
% of a black background, so that the numbers will be visible
% on top of it.
I = im2uint8(bw);
I(~bw) = 200;
I(bw) = 240;
imshow(I, 'InitialMagnification', 'fit')

% Now plot the number of each sorted object at the corresponding
% centroid:
hold on
for k = 1:numel(s2)
   centroid = s2(k).Centroid;
   text(centroid(1), centroid(2), sprintf('%d', k));
end
hold off
We sorted the output of regionprops, but we haven't touched the label matrix itself. We can relabel it according to the sort order by using linear indexing and the PixelIdxList of each object. An object's PixelIdxList is a vector of linear indices for the pixels belonging to the object. Here's the relabeling loop:
for k = 1:numel(s2)
   kth_object_idx_list = s2(k).PixelIdxList;
   L(kth_object_idx_list) = k;
end
In MATLAB 7.6 (R2008a), the publish feature lets you capture multiple graphics from within a loop. I'll use that new capability to show the location of the first few relabeled objects in L.
for k = 1:5imshow(L == k)
endSoon I'll write another post that shows how how to match up labels in objects that overlap between two images.
- Category:
- Connected components


Comments
To leave a comment, please click here to sign in to your MathWorks Account or create a new one.