Last August I posted an example showing how to display patch objects transparently over an image. I meant to follow that up with another post showing a couple of ways to display one image transparently over another. I was embarrassed to discover recently that I had completely forgotten to post the follow-up.
So here it is!
Handle Graphics image objects can be displayed transparently. In fact, each individual pixel can be assigned a different level of transparency. This can be used in various ways to view one image on top of another. In my first example for today, I'll use a "checkerboard" transparency pattern to view a gray-scale image on top of the original color image.
First, display the color image and the gray-scale image together, in the same place.
rgb = imread('peppers.png'); imshow(rgb); I = rgb2gray(rgb); hold on h = imshow(I); % Save the handle; we'll need it later hold off
Not too surprisingly, only the gray-scale is visible. That's because it's "covering up" the color image. Let's give it a "checkerboard" transparency pattern, so that some of the pixels are fully opaque, and others are fully transparent.
[M,N] = size(I);
block_size = 50;
P = ceil(M / block_size);
Q = ceil(N / block_size);
alpha_data = checkerboard(block_size, P, Q) > 0;
alpha_data = alpha_data(1:M, 1:N);
set(h, 'AlphaData', alpha_data);
Now we can see some of both images. This visualization technique is often used to evaluate image fusion algorithms.
Using image data to control transparency
My second transparency example gets a bit more creative. I'll display an image that's a solid color, but I'll use another data set to vary the solid color image's transparency on a pixel-by-pixel basis.
Here's a digital elevation model (DEM) of Peppercorn Hill and North Pond in Massachusetts.
E = imread('peppercorn_hill.png'); imshow(E, 'InitialMag', 'fit')
The bright blob at the upper left is Peppercorn Hill, and the flat, dark plateau in the upper middle is North Pond.
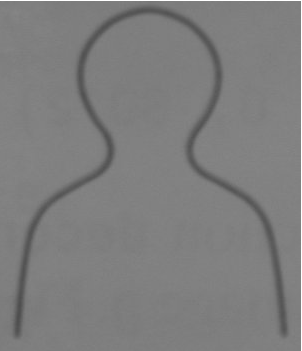
Below is an "influence map." This is a visualization of down-hill water flow, starting from the peak of Peppercorn Hill.
I = imread('peppercorn_hill_influence_map.png'); imshow(I, 'InitialMag', 'fit')
It's difficult to interpret the influence map image on its own, apart from the original DEM. Let's visualize the two images together as follows:
- Display the original DEM image.
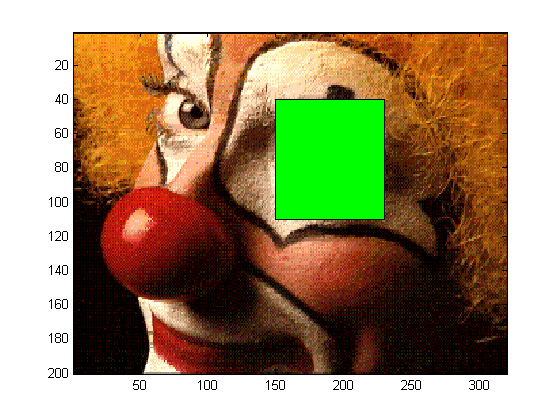
- Display a solid green "image" on top of the original image.
- Use the influence map pixels to control the transparency of each pixel of the green image.
imshow(E, 'InitialMag', 'fit') % Make a truecolor all-green image. green = cat(3, zeros(size(E)), ones(size(E)), zeros(size(E))); hold on h = imshow(green); hold off
% Use our influence map image as the AlphaData for the solid % green image. set(h, 'AlphaData', I)
Now it's easy to understand the water flow in the context of the original DEM image. We can see that the water flows from the peak into the pond, then out the southern end of the pond.
So there you go, better late than never. Two more image visualization techniques to add to your bag of tricks.
Get
the MATLAB code
Published with MATLAB® 7.7


This is really cool! What is the best way to output the result as, say, a .tiff file?
Arjun—I’d use print with the -dtiff -rnum options.
Hi
I have error message when I execute this code. It says “imshow (ParseInputs)
Unknown option string “fit”.. “.
I’m using matlab 6.5.01.
Thanks,
Zul—You are using a version of MATLAB from almost seven years ago. The ‘fit’ option wasn’t in the imshow back then.
Thanks for the great tutorial.
What would a convenient way to save the processing result? I want to save the result as an image of the same size as the original image (i.e. background), but not sure how to do it from the figure (so the image could be used for further processing).
General, saving the figures in Matlab seems poorly done (when saving a graph or an image from the figure, say as tif, the pixel size of the saved file varies depending on the size of the window, i.e. screen resolution). Any advice on how to save figures with less hassle would be greatly appreciated.
Second, is there an alternative way to do the same thing but without using imshow (i.e without invoking the figure)? Besides the above issue with saving figures, I need to process big batches of files in this manner, and was wondering if the opening/closing figure can be avoided?
Thanks so much.
Dusan—If we had designed it the other way, someone would have posted “saving figures in MATLAB seems poorly done; no matter how big the figure is on the screen, it always saves with the same resolution.” :-) I understand you, though. There are ways to control what you get. I recommend using the print function with the -dtiff and -rnum options, where num is the desired resolution in pixels per inch.
You should be able to do all of this in an invisible figure. That is, create a figure with ‘Visible’, ‘off’. If that isn’t satisfactory, you’ll have to do a little programming yourself to implement the operation. Do an internet search for “image compositing.”
What can I do if I need to compare two image file?
one image is the image that I draw from a raw data, another image is from the pdf ( I can crop it). I hope I can compare this two image files with the second file are transparency?
Is it possible?
Nick—Your question is a little vague, so it’s hard to give a precise answer. This post shows you how to overlay one image transparently over another. MATLAB does not have a function for reading from a PDF file, so you’ll need to find another tool to get that image.
Let me ask the question in another way.
How can I put one image file transparent on top of another image file?
Nick—Is there some reason that the method described in this post is not working for you?
I’m wondering if this tip puts me on the right track for what I’m trying to do. I’m trying to display a picture of a scene with a certain object in it “blacked out”. Then, one bit (or pixel, or unit, or whatever) at a time, I want to reveal the hidden object to see how fast users can recognize it. Mr. Eddins states “each individual pixel can be assigned a different level of transparency”, so should I be adjusting the transparency of individual pixels (or groups of them) to achieve the effect I desire? I’m brand new to Matlab, so any pointers I can get would really help.
when I use the h = imshow(green);
it shown error:
??? Error using ==> imageDisplayParseInputs>validateCData at 286
Unsupported dimension
Error in ==> imageDisplayParseInputs at 207
common_args.CData = validateCData(common_args.CData,image_type);
Error in ==> imshow at 199
[common_args,specific_args] = …
What is this about?
I’m really new to MATLAB
another error is:
??? Error using ==> set
Bad value for image property: ‘AlphaData’
so what value is suitable for ‘AlphaData’ ?
thank you very much.
Hi Steve,
I am trying to use your method to overlay say correlation scores which is a matrix on a BIG image. So, first i try to copy the pixel value to cover that sub-image region that maps a correlation score to entire sub-image. Is there an easier way to do that, repmat wouldnt work since it would replicate entire matrix not pixel dilation of sorts which i need?
Anyways, main question concerning overlay is that how do i overlay the correlation score map with a colormap set on it? the usual way wouldnt work.
Thanks so much
Hi Steve,
I realized one major issue concerning this approach is that the overlay image has to be as big as the image under. Is there any way around it ? i am always runnign out of memory.
Thanks.
Tom—I think you could the image overlay transparency technique to do what you’re describing. You can change the transparency of individual pixels in order to reveal the hidden object a little bit at a time.
Tom and Rishabh—Your overlay image does not need to be as large as the image underneath. By setting the XData and YData properties of the overlay image, you can position it to display over the desired location of the image underneath.
Tom—You’ll need to learn something about Handle Graphics and the properties of graphics objects in MATLAB to program what you’re trying to do. There’s a lot of documentation on this. Look for general information about how to set and get object properties, and then look at specific information about the image object and its CData, AlphaData, XData, and YData properties.
NSJ—Make sure that your green variable is M-by-N-by-3. Look in the MATLAB documentation for information about the AlphaData property of the image object. Here’s a link to get you started.
Hi Steve,
I’m having trouble saving my final image. I’m getting the following error with the print command-
Warning: Files produced by the ‘tiff’ driver cannot be sent to printer.
File saved to disk under name ‘figure1.tif’.
> In graphics\private\name at 64
In print at 202
Warning: Problems in UIW_SetUpGLPrinting
> In C:\Program Files\toolbox\matlab\graphics\private\render.p>render at 129
In print at 263
Any help would be appreciated.
Thanks,
Ben
Benjamin—When you save to TIFF using print, you need to give it a filename, like this:
Hi Steve,
Sorry, yes I forgot to give the image title.
I’m still getting the following error-
Warning: Problems in UIW_SetUpGLPrinting
> In graphics\private\render at 142
In print at 267
I’m using Matlab R2007b
Thank you for your time
Benjamin—You’ll need to contact technical support for help.
Hi, Steve
I can not understand how do it in 2nd example. In fact, i can not repeat your result. can you list these commands one by one? sorry about that.
Zhenghui—Click on the “Get the MATLAB code” link at the bottom of the post.
I am trying to do something similar to this, but I want to overlay a plot onto the image. When I try to save it with the print command, I get a new image that is a different resolution. Do you know of a way to print to a specified resolution (say 1600×1200 pixels)?
Thanks
Jay—Set the figure to have the desired size and units, set the figure’s PaperPositionMode to ‘auto’, and then use the -r switch with print.
I tried to use your second example to overlay a picture with a transparent box. But I get an unknow mistake:”??? Error using ==> imageDisplayParseInputs>validateCData at 249
Unsupported dimension
Error in ==> imageDisplayParseInputs at 202
common_args.CData = validateCData(common_args.CData,image_type);
Error in ==> imshow at 173
[common_args,specific_args] = …
Error in ==> plot at 84
h = imshow(green);” What is the Problem. I use Matlab 7.5.0
Hello Steve,
I’ve got another problem concerning the first example.
After processing the line “set(h, ‘AlphaData’, alpha_data);” my figure shows only the a few rows of the image. The Alpha_data and the image have the same dimension. This problem will also appear, if I run the script as shown in this article.
Is there an opportunity to overlay some picture, add text and save the “figure” as png or jpg without displaying it on the screen?
Kai—Use dbstop if error to get MATLAB to stop when the error occurs. Then examine the variables in your code to see what might be the problem. For example, look at the size of the variable green in the call to imshow.
Also, I encourage you to use the “Get the MATLAB code” link at the bottom of the blog post to make sure you are using the same code that I posted.
Regarding saving a figure without it appearing on screen—create an invisible figure:
fig = figure('Visible', 'off')Then plot into the figure and use print -dpng to print the figure.
Hallo Steve,
thanks for your help. The problem was, that my images are imported as rgb colored pics. After converting with rgb2gray, the program run perfectly.
Another question. If I use print to save the current figure, the image will be saved bigger than I need. At the moment I reload the picture cut it and save it again. How can I replace this second step. Can I set a size for my figure. Or is there an option to save the overlayed axes without margin.
Thanks for help
Kai
Kai—You can control the size of the figure explicity by setting the figure properties. You can also control the size of the axes object in which the image is drawn by setting the axes properties. See the MATLAB Graphics doc for information about the ‘Units’ and ‘Position’ properties for figure and axes objects.