I recently heard a MathWorks application engineer (hi, Brett!) say that a short little paragraph in the regionprops documentation was very "powerful." Here it is:
The function ismember is useful in conjunction with regionprops for selecting regions based on certain criteria. For example, these commands create a binary image containing only the regions whose area is greater than 80.
idx = find([stats.Area] > 80); BW2 = ismember(L,idx);
When I heard Brett's comment, I immediately pulled out my high-tech note-taking device (index card) from my back pocket and wrote: "regionprops - ismember - blog topic."
The basic idea is this: If I have a binary image containing objects, how can I make a new binary image containing a subset of the objects satisfying certain criteria? The answer is in three parts:
1. Use bwlabel and regionprops to compute measurements of the objects.
2. Compute a vector of labels for the objects satisfying the criteria. Sometimes a special structure syntax called the "comma-separated list" is very useful for this step; I'll show that syntax below.
3. Use ismember to compute the desired binary image.
I've posted several examples using bwlabel and regionprops, so I won't go into much detail about them. You label objects in a binary image using bwlabel, and then you compute geometric measurements of the labeled objects using regionprops.
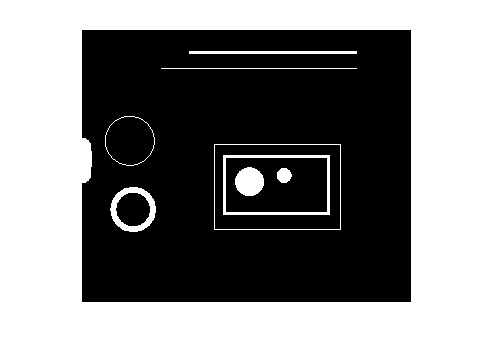
Let's use the blobs.png image for our example.
bw = imread('blobs.png');
imshow(bw)
L = bwlabel(bw); s = regionprops(L, 'Area', 'BoundingBox'); s(1)
ans =
Area: 35
BoundingBox: [0.5000 0.5000 14 14]
regionprops returns a structure array containing the desired measurements for each object.
The comma-separated list syntax for structures offers an easy way to convert a particular field from a structure array into a vector, assuming that the field value is always a scalar. Here's how it works. When s is a structure array with field foo, and you write the following expression:
s.foo
MATLAB translates that into this "comma-separated list":
s(1).foo, s(2).foo, ..., s(end).foo
Therefore, if s(k).foo is a scalar, you can create a vector of all the foo values by enclosing s.foo in brackets, like this:
foo_fector = [s.foo];
Here's how it works for the 'Area' measurements we computed above for the blobs.png image.
area_values = [s.Area]
area_values =
Columns 1 through 7
35 393 19 139 36 58 736
Columns 8 through 14
53 2 2 1 2 2 2
Columns 15 through 21
1 196 3940 4326 504 40 422
Columns 22 through 28
966 655 175 40 39 1108 35
Suppose we want a list of all the objects whos area is between 100 and 1000. We can do that using find and relational operators, like this:
idx = find((100 <= area_values) & (area_values <= 1000))
idx =
2 4 7 16 19 21 22 23 24
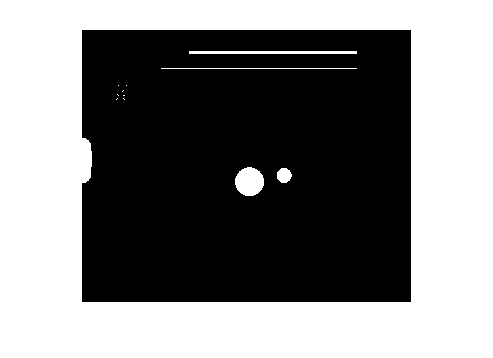
And that brings us to ismember. We can construct a binary image containing all the objects whos area is between 100 and 1000 by passing L and idx to ismember.
bw2 = ismember(L, idx); imshow(bw2)
Let's try that with another measurement, solidity. Solidity is defined as the area of the region divided by the area of the convex hull of the region.
s = regionprops(L, {'Solidity'});
solidity = [s.Solidity]
solidity =
Columns 1 through 9
0.2397 0.9680 0.6786 0.0700 0.8000 0.1321 0.4461 0.7910 1.0000
Columns 10 through 18
1.0000 1.0000 1.0000 1.0000 1.0000 1.0000 1.0000 0.0972 0.1681
Columns 19 through 27
1.0000 0.2235 0.0386 0.1505 0.9791 0.9669 0.2260 0.2191 0.5604
Column 28
0.2397
Here are all the objects with a solidity of 0.9 or higher:
imshow(ismember(L, find(solidity >= 0.9)))
And here are all the objects with a solidity of 0.25 or lower:
imshow(ismember(L, find(solidity <= 0.25)))
Get
the MATLAB code
Published with MATLAB® 7.7


Hi Steve.
I am regularly reading your posts. I got impressed by your great ideas.All r very useful to my work. Can u pls tell me the procedure by which regionprops finds perimeter and Max Lenght of an Object? Thanks in Advance.
Nice feature Steve. I guess I should have read the documentation more carefully. What I had been doing is to loop through all blobs, seeing if each blob met the criteria for exclusion, and then using its PixelIdxList to erase it’s pixels from the original binary image. Looks like that can be replaced with just a line or two using your method. Of course we then need to run bwlabel() and regionprops() again to get a new structure of blob measurements with just the acceptable blobs in it.
Mark—If you just need the measurements for the objects, then relabeling may not be necessary. I guess it depends on the nature of the follow-up processing.
Kavitha—See the ComputePerimeter subfunction of regionprops. There is no “Max Length” measurement for regionprops.
hi steve…nice work…i was wondering….what if we have a hole in one of the solidity r the labeled object and we need to find the centroid of those holes?…is it possible?
Nanditha—Yes, it’s possible, but it will require a bit of coding. You could use the ‘FilledImage’ and ‘Image’ measurements of regionprops to identify the pixels that belong to holes, and then use findmean to compute the centroids.
thank u:)…..i’ll try this out:)
Hi steve i’m using the regionprops to find the area with binary value of 1. How to convert this area in cm^2
Kushairy—You’ll need to know the spatial dimensions of each pixel. If you do not know that, you’ll need to do some sort of camera calibration, possibly aided by the use of fiducial marks in your scenes.
Hi Steve,
I’ve got a b&w image(pixel values are only 1s and 0s) of bubbles in water, where bubbles are black and water is white.
Do you have any idea how to position the bubbles in water? Such as naming (x,y) positions of each centres of the bubbles or any other way.
Many thanks in advance.
@Wei - I think you are looking for the centriod of the bubbles. Centriod calculations are part of the output from REGIONPROPS. The example in the doc is complete:
BW = imread('text.png');s = regionprops(BW, ‘centroid’);
centroids = cat(1, s.Centroid);
imshow(BW)
hold on
plot(centroids(:,1), centroids(:,2), ‘b*’)
hold off
Hi Steve,
I have lots of fluorescent water droplets on a plate, in an RGB file and i want to know the mean intensity of each droplet. I’m thinking regionprops and a ‘meanintensity’ property, but i also want to see on the figure output the regions I’m selecting.
your advice would be awesome!
Thanks in advance
Charles—The reference page for regionprops includes an example that shows how to “mark” the center of an object with an asterisk (or some other marker). Would that help?
i was wonder when i recieve the stats.Image , it is smaller from the original image how i can set it in the original image size?
Mix—Use the BoundingBox property to determine where the object is located in the original image.
I’m wondering if there is an easy way to substitute a certain regionprops characteristic with the numbered labels as produced by bwlabel.
This would be a standard reclassification in GIS terms, where you replace the patch number by the characteristics associated with the patch. However I don’t seem to find a numbered value in the regionprops output that binds it to the bwlabel output. Although it should be possible as you produce a selected image using ismember().
Any solutions here?
Koen—The k-th element of the output of regionprops corresponds to the object labeled the value k in the output of bwlabel. In other words:
Does that help?
Steve,
I have another question about ‘regionprops’, and hope that you may shed some light on it. Thanks in advance.
I have been working on calculating the orientation of an image shape based on moments. Here are my questions:
1. From wikipedia and other sources, the orientation of a shape is computed by:
orientation = 0.5*atan(2*u11/(u20-u02))*180/pi,
where u11, u20, and u02 are second order central moments.
2. But the code in the matlab function ‘regionprops’ is (uxx, uyy, and uxy are actually u20, u02, and u11, respectively):
————————
———————–
Why is the formula different from what is described in wikipedia (the additional ’sqrt’ term)?
3. Does the above calculations about image orientations apply both to binary and grayscale images? For grayscale images, the shape would be the whole image.
4. Also, regionprops calculates the second momemts as follows. Would you please explain what the term ‘1/12′ means. Is it still necessary if we are dealing with grayscale images?
—————————
—————————
Thanks again.
Yuan-Liang—1. I can’t explain formulas that appear in unspecified wikipedia pages or other sources, and “orientation of a shape” is a phrase that needs a more specific definition. Our code is computing the orientation of the ellipse that has the same normalized 2nd-order moments as the shape in question, and the equations for that come from Haralick and Shapiro, Computer and Robot Vision vol I, Addison-Wesley 1992, Appendix A. 2. I feel no particular need to rederive the Haralick equations at the moment, especially since I just did a spot-check of regionprops using line segments at various angles, and regionprops is returning accurate answers. 3. These formulas are for flat shapes only, so they would not apply directly to grayscale images. 4. Does the code comment not supply sufficient information about where the 1/12 term comes from?
hello steve. I have been doing image procesing for retinal images for past 2 months. I have segmented some required portions from the image.These are gray scale images. now how can i use ‘regionprops’ for computing the mean intensity of the segmented region in the gray scale image. Pls help.
Prashanth—If you have a relatively recent version of the Image Processing Toolbox, you can pass in your gray scale image as the second argument to regionprops and compute the ‘MeanIntensity’ measurement.
what is foo?
and what would it be on my script?
Ayrton—”foo” is just a fieldname I made up in order to illustrate the comma-separated list syntax.