It is Friday the 13th Again
Today is Friday, March 13, 2020. In many parts of the world, Friday the 13th is considered unlucky. I've written blog posts about Friday the 13th before, 2012, 2018, but I will have something new to say today.
NOTE: Somehow the figures were being misplaced. It seems to be OK now, but I am retaining the anchors in the text, just in case.
Contents
Questions
Is Friday the 13 not only unlucky, bit is it also unlikely? What are the chances that the 13th of any month falls on Friday? Which months are more likely to have Friday the 13th? Which years are more likely to have Friday the 13th?
Leap Years
Leap years make our calendar a nontrivial mathematical object. The leap year rule can be implemented by this anonymous function.
leapyear = @(y) mod(y,4)==0 & mod(y,100)~=0 | mod(y,400)==0;
This says that leap years happen every four years, except for the turn of centuries not divisible by 400. Let's try a few year numbers.
    y = [2020 2021 2000 2100]';
    isleap = [y leapyear(y)]
isleap =
        2020           1
        2021           0
        2000           1
        2100           0
So, this year is a leap year, but next year is not. The turn of the century two years ago in 2000 was a leap year, but the next turn of the century in 2100 will not be one.
Calendars
The leap year rule implies that our calendar has a period of 400 years. The calendar for years 2000 to 2399 will be reused for 2400 to 2799. In a 400-year period, there are 97 leap years, 4800 months, 20871 weeks, and 146097 days. So, the average number of days in a calendar year is not 365.25, but
dpy = 365+97/400
dpy =
  365.2425
At first glance, you might say that the probability of the 13th of any month being a Friday is 1/7, because there are seven days in a week and they are all equally likely. But that's not quite correct. We can count the number of occurrences of Friday the 13th in the 4800 months in a calendar period. The correct probability is then that count divided by 4800. Since 4800 is not a multiple of 7, the probability does not reduce to 1/7.
Datetime
The datetime object, introduced in MATLAB in R2014b, is the tool we need for this job.
The documentation for datetime is available here, or, from within MATLAB, with the command
doc datetime
For example, here is the date and time when I am writing this post.
d = datetime('now')
d =
  datetime
   13-Mar-2020 21:17:57
I can specify a custom display format that includes the weekday with
d = datetime(d,'Format','eeee, MMMM d, yyyy HH:mm:ss')
d =
  datetime
   Friday, March 13, 2020 21:17:57
The available display formats include support for an international standard, ISO 8601.
Vectorize
Let's get on with Friday the 13th. Like most things in MATLAB datetime works with vectors. The statements
    y = 2000;
    m = 1:4800;
    t = 13;
    v = datetime(y,m,t);
produce a row vector of 4800 datetime's for the 13th of every month. The first few and last few are
    fprintf('  %s',v(1:4))
    fprintf('  ...\n')
    fprintf('  %s',v(end-3:end))
  13-Jan-2000  13-Feb-2000  13-Mar-2000  13-Apr-2000  ...
  13-Sep-2399  13-Oct-2399  13-Nov-2399  13-Dec-2399
The statement
w = weekday(v);
produces a row vector of 4800 flints between 1 (for Sunday) and 7 (for Saturday). The first few and last few are
    fprintf('%3d',w(1:4))
    fprintf('  ...')
    fprintf('%3d',w(end-3:end))
5 1 2 5 ... 2 4 7 2
Now to get the counts of weekdays, all we need is
counts = histcounts(w)
counts =
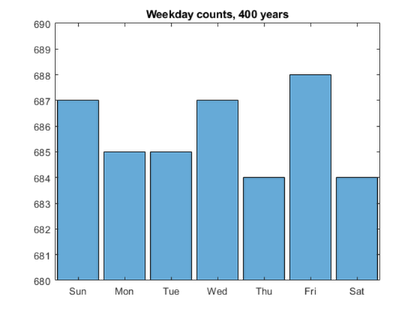
   687   685   685   687   684   688   684
There you have it. The count for Friday, 688, is higher than for any other day of the week. The 13th of any month is slightly more likely to fall on a Friday.
The probabilities are
prob = counts/4800
prob =
    0.1431    0.1427    0.1427    0.1431    0.1425    0.1433    0.1425
Compare these values with their mean.
avg = mean(prob)
avg =
    0.1429
Four probabilities are below the mean, three are above.
Categorize
Let's pair the counts with the days of the week, using a categorical variable, introduced in R2013b.
    cat = categorical(w,1:7,weekday_names);
    summary(cat)
     Sun      Mon      Tue      Wed      Thu      Fri      Sat
     687      685      685      687      684      688      684
When we plot a histogram, the appropriate labels are provided on the x-axis. Friday the 13th is the winner.
    histogram(cat,'BarWidth',0.5,'FaceColor',colors(2))
    set(gca,'ylim',[680 690])
    title('Weekday counts, 400 years')

"Weekday counts, 400 years" should be above here.
Months
Here are several other histograms of distributions of Friday the 13th. First, over the 400-year period of the calendar, which months are more likely to have Friday the 13th? Create a categorial variable by months.
    friday13s = v(w==6);
    cat_months = categorical(month(friday13s),1:12,month_names);
The histogram shows us that this month, March, and five other months, have a number of Friday the 13ths that is slightly above average. August and October have the fewest.
    histogram(cat_months,'BarWidth',0.5,'FaceColor',colors(3))
    set(gca,'ylim',[55 59],'ytick',56:58)
    title('Friday 13th, month')

"Friday 13th, month" should be above here.
Years
Which years are more likely to have Friday the 13th? Look at the last digit of the year number.
    year_mod10 = mod(year(friday13s),10);
    digits = split(string(num2str(0:9)));
    cat_mod10 = categorical(year_mod10,0:9,digits);
The histogram reveals that this year, 2020, and any other years that begin a decade, are the least likely to have unlucky Fridays.
    histogram(cat_mod10,'BarWidth',0.5,'FaceColor',colors(4))
    set(gca,'ylim',[64 73],'ytick',65:72)
    title('Friday 13th, last digit of year')

"Friday 13th, last digit of year" should be above here.
Frequency
How many unlikely Fridays are there each year? Here is a rough histogram of the number per year over the entire 400-year period of the calendar. We can see there appears to be between one and three each year, but to be more specific about the details of the distribution is elusive.
    years = year(friday13s);
    plot(2000:2399,histc(years,2000:2399),'.')
    set(gca,'xlim',[1990 2409],'ylim',[0 4],'ytick',1:3)
    title('Friday 13th per year, 400 years')

"Friday 13th per year, 400 years" should be above here.
Decade
Let's concentrate on just this decade, 2020 through 2029. Here is a list of all the 16 Friday the 13ths in this range.
    decade = (years>=2020 & years<2030);
    disp(friday13s(decade)')
   13-Mar-2020
   13-Nov-2020
   13-Aug-2021
   13-May-2022
   13-Jan-2023
   13-Oct-2023
   13-Sep-2024
   13-Dec-2024
   13-Jun-2025
   13-Feb-2026
   13-Mar-2026
   13-Nov-2026
   13-Aug-2027
   13-Oct-2028
   13-Apr-2029
   13-Jul-2029
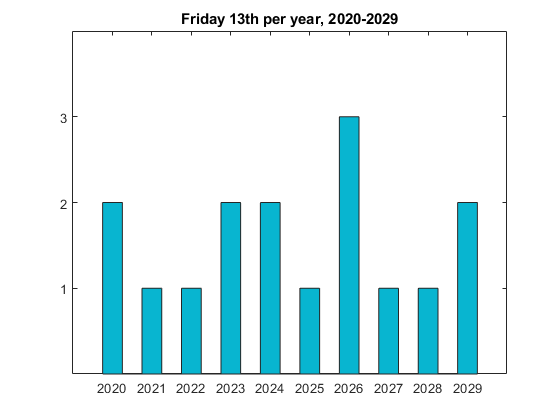
And here is the histogram of the counts. We see two this year (today and again in November). Then there is only one next year, and only one the year after that. But there will be three in 2026. That's the only three-count this decade.
    hist(years(decade),2020:0.5:2029,'binwidth',0.5)
    set(get(gca,'child'),'FaceColor',colors(5))
    set(gca,'xlim',[2019 2030],'xtick',2020:2029, ...
            'ylim',[0 4],'ytick',1:3)
    title('Friday 13th per year, 2020-2029')

"Friday 13th per year, 2020-2029" should be above here.
Quiz
If you have stayed with me this long, maybe you are ready for some homework.
- Explain why there has to be at least one Friday the 13th each year.
- Explain why there can never be more than three in any year.
- How many different ways are there to have three in a year? 2026 is one example.
Now I better quit and get this posted while it is still Friday the 13th.
Good luck.
- 类别:
- Fun,
- History,
- Programming


评论
要发表评论,请点击 此处 登录到您的 MathWorks 帐户或创建一个新帐户。