
COVID-19 Simulator
Contents
Simulator
help covid19
Epidemic simulation.
Inspired by Washington Post graphic by Harry Stevens, March 14, 2020.
https://www.washingtonpost.com/graphics/2020/world/corona-simulator/?itid=sf_
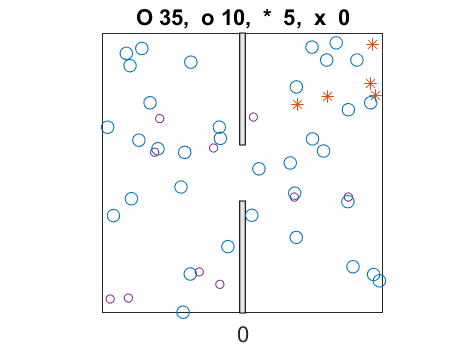
These are the four types of individuals.
* Mobile. Susceptible, on the move.
Blue (or green) circle, O.
* Static. Susceptible, stay at home.
Smaller, darker blue circle, o.
* Infected. Infects other susceptible individuals within distance "radius".
Red-orange asterisk, *.
* Immune. Was infected for "duration" steps. No longer infectious.
Darker red x.
These are the seven controllable parameters, with their starting values.
n = 50; population size
infected = .10; initial infected fraction
static = .20; static fraction
radius = .03; infectious distance
duration = 200; time of infection
speed = .03; speed of propagation
barrier = .80; barrier height
The epidemic starts in the upper right quadrant.
The epidemic ends when all infected individuals have become immune.
Folders named covid19
Desktop\covid19
Animation
First frame
The animation begins with 5 infections in the upper right quadrant. There are 45 unaffected.
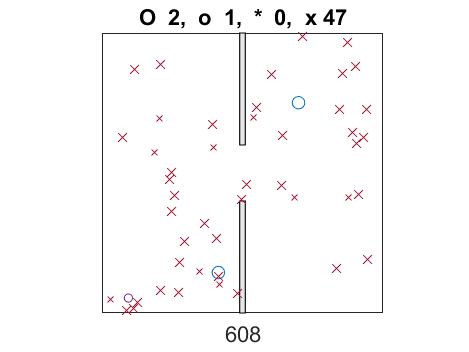
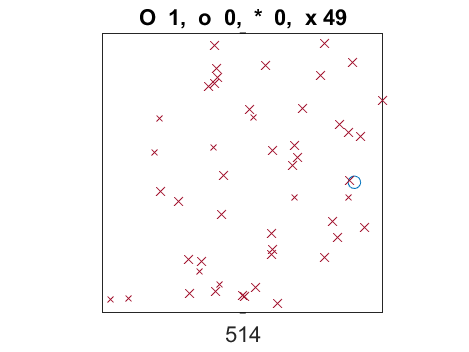
Final frame
The animation ends when there is no more infection. Three individuals have never been infected.
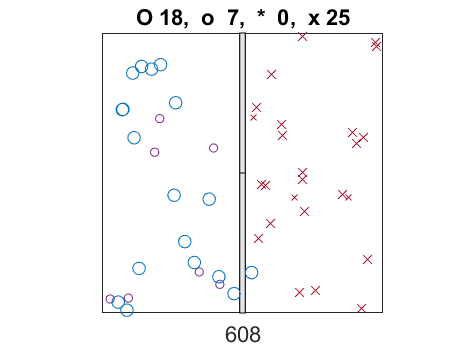
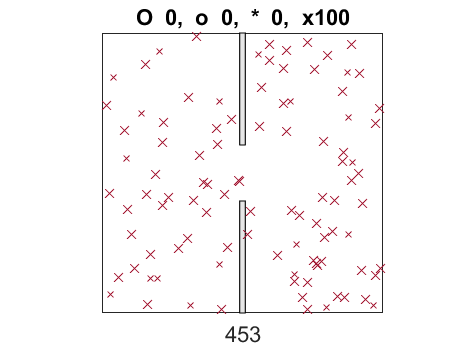
Full barrier
Final frame with complete barrier. Left half is not infected.
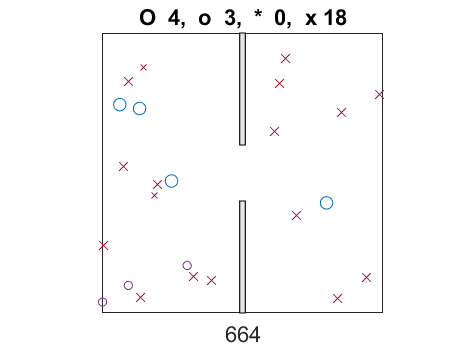
No barrier
One individual is never infected.
Larger population
Everybody is eventually infected, and in fewer time steps.
Smaller population
Less infection.
Software
The code is one of the experiments in version 5.0 of Cleve_Lab on the MATLAB Central File Exchange, available here.
The code is on the File Exchange by itself, available here.
- Category:
- Graphs,
- History,
- Simulation


Comments
To leave a comment, please click here to sign in to your MathWorks Account or create a new one.