Speeding up your program through Profiling
I was originally going to write about about a minor feature of the MATLAB Profiler, but while skimming through the archives here, I realize we haven’t really talked much about profiling at all! So it’s time to go back to MATLAB basics and talk about Profiling.
The Profiler is one of several dynamic analysis tools. The most common form of dynamic analysis focuses on correctness. In that workflow, you run your code and check whether the calculated result matches the expected result. If it doesn’t match you either made some bad assumptions about your data or there’s a bug in the program. You can use tools like the MATLAB Debugger and M-Lint to figure out the problem. A less common way to analyze code is to look at efficiency, in this case how long it takes to run (we’ll look in to memory another time). The Profiler lets you run a program and then look at how long each line took to execute. With this information you can concentrate on optimizing the sections of code that take up the most time.
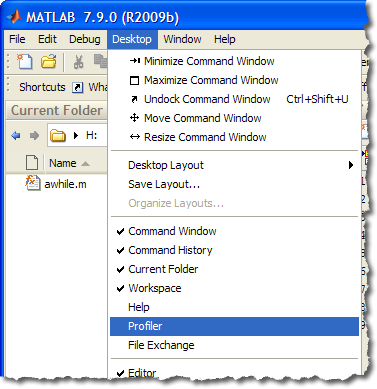
By default the Profler is not visible on the Desktop. To get it, use the Desktop menu, under Desktop -> Profiler. This brings up the Profiler window (it looks like the Web browser).
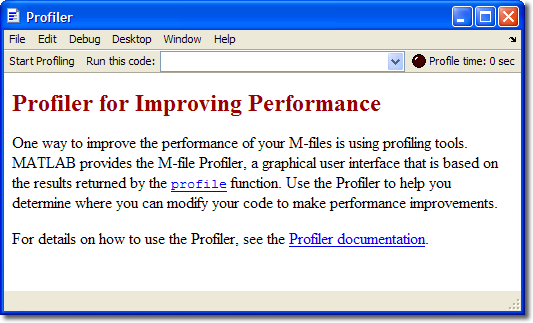
In the Profiler’s toolbar enter the MATLAB command(s) you wish to profile (where the URL would go if it were a web browser). You can combine multiple MATLAB statements with a “,” or “;”. This way you can set up inputs, if necessary. For example: A = rand(10); myfun(A). Once you enter the function(s) to profile, press Enter to run them. My example uses following function awhile.m:
function z = awhile
    for i=100:100:300
        x = rand(i);
        y = rand(i);
        z = calculate(x,y);
    end
function z = calculate(x,y)
    z = conv2(x,y);
    pause(2);
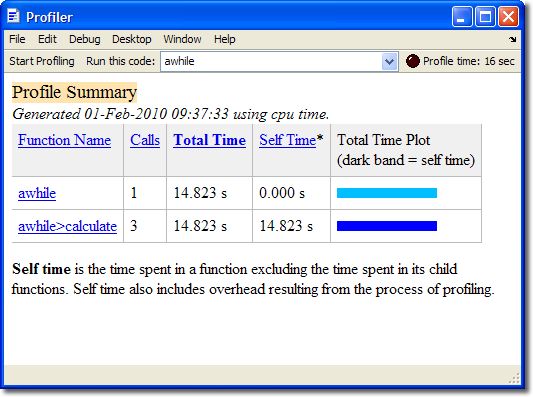
From the results below, we can see that running awhile took 16 seconds on my computer (the time is listed next to the black bullet on the toolbar). Of that 16 seconds 14.823 was spent in that one function, with almost 100% of that time spent in the three calls to the calculate subfunction. This result is not surprising given my example code. Note that 14.823 < 16. What happened to the other 1.177 seconds? The “16 seconds” reflects the total real time spent from the time the Profiler was started to when it was told to stop, rounded to the nearest second. The reported 14.823 seconds is the amount of time spent by the CPU running that code, and does not reflect the overhead of the operating system or any commands issued around the profiled function.
Clicking on a listed function or subfunction will take you to a page that lists a lot detail about each line of code in that function, including:
- Which functions called that the function and how many times
- The individual lines where the most time was spent, including the number of times that line was executed and how much time was spent on that line
- What other profiled functions were called by that function
- Any warnings reported by M-lint, which can provide suggestions for improving performance
- A coverage summary showing the number of lines run vs not run
- A color-coded version of your code, showing potential problem spots.
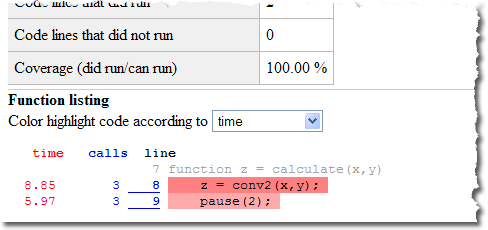
In the picture below we see that 8.85 seconds of the time was spent in conv2 and 5.97 seconds in pause. With the information presented in the report I know I can get a 40% speedup by eliminating the call to pause, but we see that the conv2 line is darker, meaning I’d get more bang for my buck by improving that line. Since this code doesn’t do anything useful, there’s nothing really to replace it with it. But in your own code you might see a way to either replace a dark red line, or call it fewer times.
To sumamrize, the workflow for profiling is:
- Find a program you wish to speed up.
- Run that code with appropriate inputs in the Profiler.
- Fix any performance-related M-Lint warnings in your file (if you haven’t already). The Profiler can help you asses which warnings are most significant.
- Look for the lines where the code spent the most time, and try to call that line fewer times, replace it with faster statements, or break your code into smaller problems.
- Repeat until there’s nothing left to improve.
The profiler can also be run from the MATLAB command line using the profile command.
EDIT (02/01/10): Fixed typo.
- Category:
- Current Directory,
- Debugging,
- Editor,
- M-Lint




Comments
To leave a comment, please click here to sign in to your MathWorks Account or create a new one.