Redesigned plot catalog in MATLAB R2011a
It’s Scott again, jumping back in with Mike to talk about some of the new features introduced in R2011a. This week I’d like to talk a little bit about the redesign of the plot catalog.
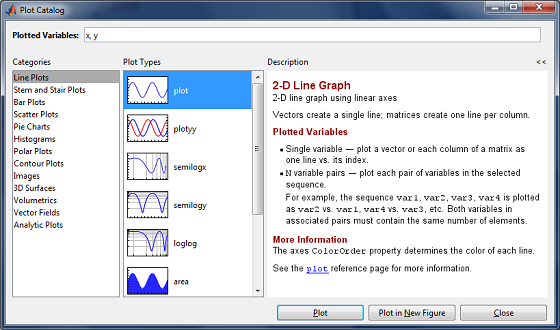
As the number of available plot types in MATLAB grew over the years, we found that it became increasingly difficult for users to discover the best plot type for their data. We introduced the plot catalog years ago to address this challenge. The plot catalog allows you to easily browse and try many of the different types of plots in MATLAB. Here’s what it used to look like (R2010b and earlier):
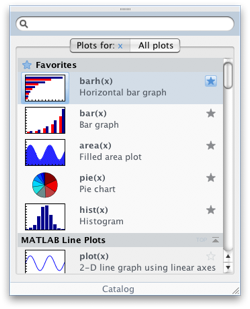
Now let’s take a look at the new (R2011a) version. Can you spot what has changed?
Some of the changes you might notice:
- There are a LOT more categories of plots listed on the left, including ones from many toolboxes
- You can search the catalog
- The help on the right is more detailed, and if necessary, explains why a selected plot type won’t work with the selected data.
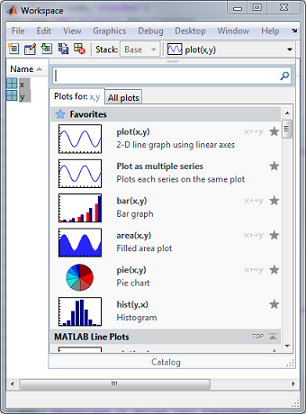
I’m guessing that many of you recognize similarities between the updated plot catalog and the updated workspace browser plot selector we introduced in R2009b. This is no coincidence!
We seriously considered throwing away the plot catalog when we introduced the redesigned plot selector. With the new ability to see all available plot types in the plot selector, we figured that there was no need to go to the plot catalog any more. We ultimately decided to keep a link to the old plot catalog at the bottom of the plot selector, just in case. We figured that this would give us a chance to hear from users whether or not it was worth keeping, or worth enhancing.
One day last year, I was having a chat with one of our European MATLAB trainers. She mentioned how much her students love the plot catalog, but wondered why it was limited to showing only plots from MATLAB without any from toolboxes. I wondered back why students would want the plot catalog at all, since they could find everything they need right in the plot selector. After a bit of discussion, we realized that the key feature of the plot catalog was simply that it was big! This let them browse around more easily than scrolling through the very long list in the plot catalog, which is really helpful when trying to get oriented to the hundreds of available visualization routines. I think of this like the difference between using an application on an iPhone and on an iPad – while you can get the same things done on an iPhone, the extra real estate on the iPad can make browsing much more comfortable. This was just the push we needed to know what to do with the plot catalog. As you may have guessed by now, we were able to use a lot of our work on the plot selector directly in the plot catalog.
I think the updated plot catalog is a great result. Thanks to our trainer’s direct observation of how people learn and use MATLAB, we were able to target improvements to support their workflows.
What do you think? Do you use the plot catalog and plot selector? Tell us how you use them here!
- Category:
- Data Tools


Comments
To leave a comment, please click here to sign in to your MathWorks Account or create a new one.