Acquire Data from Android Device Sensors with MATLAB Mobile
With the new MATLAB® Support Package for Android™ Sensors, you can now use MATLAB Mobile™ to acquire data from the sensors on your Android device. This data can be sent to a MATLAB session running on your computer for further analysis and visualization.
Step 1: Turn on the Accelerometer
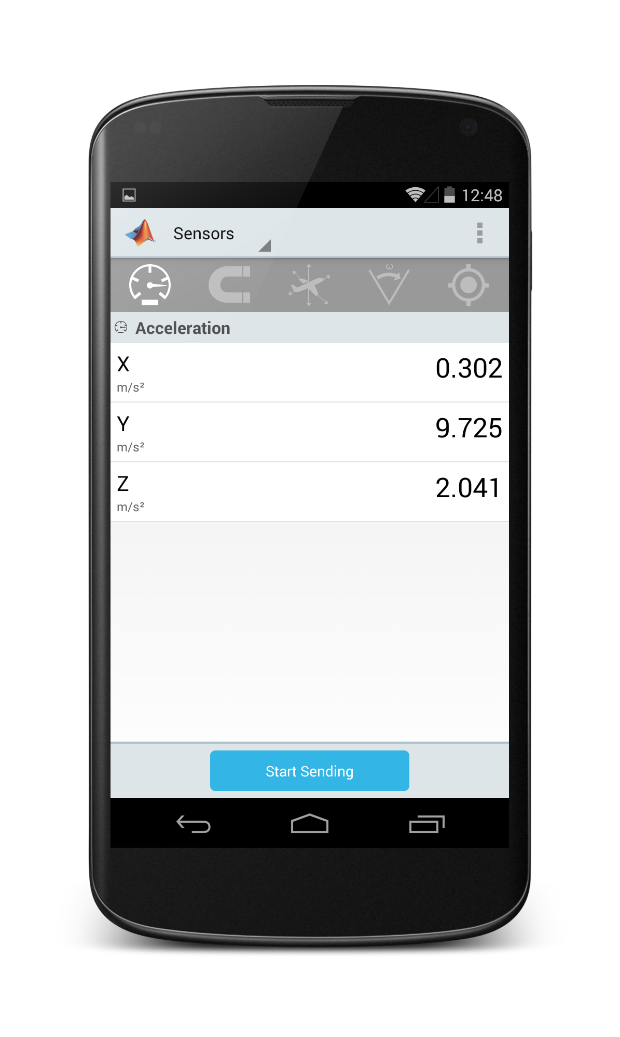
Once you have completed the 3 steps from the above section, go to MATLAB Mobile and turn on the accelerometer. You should see something akin to this:
You can also enable the sensor directly from MATLAB, by executing the following command:
Did you notice the enabled Start Sending button towards the bottom of your screen? Tap on it, and voila! You are now sending data to MATLAB. Alternatively, you can start sending data directly from MATLAB, through the following command:
Walk around your campus/home/floor with your device. Once you are satisfied, stop sending this data to MATLAB. You can either tap on the Stop Sending button on MATLAB Mobile, or issue the following command in MATLAB:
Once you have retrieved the logged acceleration data, you can plot it in MATLAB:
Calculate the magnitude to convert your X, Y and Z vectors to scalar values. Then, plot it.
To remove constant effects such as gravity, you can subtract the mean from this data.
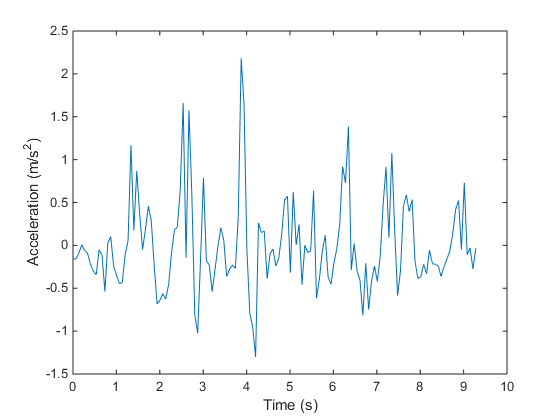
The plotted data is now centered on zero, and shows peaks which correspond to a step taken while walking.
Step 5: Count Number of Steps Taken
To determine the number of steps taken, you can use to FINDPEAKS function from Signal Processing Toolbox. In this example, we are treating only peaks with a minimum height above one standard deviation as a step. This threshold should be tuned experimentally to match a person’s level of movement while walking, hardness of floor surfaces etc.
Step 6: Clean Up
Once you are done, make sure you turn off the acceleration sensor and clear the mobiledev object.
Let us know by leaving a comment below.
Contents
What data, you ask?
On Android devices, MATLAB Mobile supports data acquisition from motion sensors like the accelerometer as well as positional sensors like the GPS. A list of all sensors is shown below.Viewing Sensor Data
You can access these sensors by selecting the Sensors option from the drop-down menu in MATLAB Mobile. You can tap on a sensor to enable it and view related measurements. The screenshot below is the result of turning on the Accelerometer and Magnetometer.
Analyze Data with MATLAB
Displaying this data is cool, but to make this truly useful, you will want to perform further analysis and processing. Fortunately, the MATLAB Support Package for Android Sensors helps you do just that! It enables you to send sensor data to a MATLAB session on your computer. To do this:- Connect MATLAB Mobile to your computer with the MATLAB Connector. This feature is only supported on MATLAB R2014a and later, so make sure you are on a compatible version.
- Install the MATLAB Support Package for Android Sensors. Choose Add-ons from the MATLAB Toolstrip, and then choose Get Hardware Support Packages. This will open the support package installer. Choose Android Sensors from the list and follow the instructions.
- To establish communication between the sensors on your device and MATLAB, create a mobiledev object, as follows:
m = mobiledev;
Example: Counting Steps by Capturing Acceleration Data
The mobiledev object facilitates communication between the sensors on your Android device and the MATLAB session running on your computer. Let’s explore this workflow through an example that illustrates the collection of acceleration data and using it to count the number of steps taken.Step 1: Turn on the Accelerometer
Once you have completed the 3 steps from the above section, go to MATLAB Mobile and turn on the accelerometer. You should see something akin to this:
You can also enable the sensor directly from MATLAB, by executing the following command:
m.AccelerationSensorEnabled = 1;Step 2: Send Data to MATLAB
Did you notice the enabled Start Sending button towards the bottom of your screen? Tap on it, and voila! You are now sending data to MATLAB. Alternatively, you can start sending data directly from MATLAB, through the following command:
m.Logging = 1;You can verify this in MATLAB, note the Current Sensor Values in the result:
m
m =

mobiledev with properties:

                   Connected: 1
                     Logging: 1
            InitialTimestamp: '02-Oct-2014 21:53:26.707'

   AccelerationSensorEnabled: 1    (20 Logged values)
AngularVelocitySensorEnabled: 0
       MagneticSensorEnabled: 0
    OrientationSensorEnabled: 0
       PositionSensorEnabled: 0

Current Sensor Values:
                Acceleration: [0.2631 5.9226 8.1850] (m/s^2)
Step 3: Stop Acquiring Data and Retrieve Logs
Walk around your campus/home/floor with your device. Once you are satisfied, stop sending this data to MATLAB. You can either tap on the Stop Sending button on MATLAB Mobile, or issue the following command in MATLAB:
m.Logging = 0;To retrieve the data, use the accellog variable:
[a, t] = accellog(m);Step 4: Plot Raw Sensor Data
Once you have retrieved the logged acceleration data, you can plot it in MATLAB:
plot(t, a);
legend('X', 'Y', 'Z');
xlabel('Relative time (s)');
ylabel('Acceleration (m/s^2)');
Calculate the magnitude to convert your X, Y and Z vectors to scalar values. Then, plot it.
x = a(:,1);
y = a(:,2);
z = a(:,3);

% Calculate and plot magnitude.
mag = sqrt(sum(x.^2 + y.^2 + z.^2, 2));
plot(t, mag);
xlabel('Time (s)');
ylabel('Acceleration (m/s^2)');
To remove constant effects such as gravity, you can subtract the mean from this data.
% Accounting for gravity.
magNoG = mag - mean(mag);

% Plot magnitude.
plot(t, magNoG);
xlabel('Time (s)');
ylabel('Acceleration (m/s^2)');
The plotted data is now centered on zero, and shows peaks which correspond to a step taken while walking.
Step 5: Count Number of Steps Taken
To determine the number of steps taken, you can use to FINDPEAKS function from Signal Processing Toolbox. In this example, we are treating only peaks with a minimum height above one standard deviation as a step. This threshold should be tuned experimentally to match a person’s level of movement while walking, hardness of floor surfaces etc.
% Use FINDPEAKS to determine the local maxima.
minPeakHeight = std(magNoG);
[pks, locs] = findpeaks(magNoG, 'MINPEAKHEIGHT', minPeakHeight);
The number of steps taken is the number of peaks:
numSteps = numel(pks)
numSteps =

    15
Finally, you can also identify these locations on your plot of acceleration magnitude data:
hold on;

% Place a red marker on the locations that correspond to peaks.
plot(t(locs), pks, 'r', 'Marker', 'v', 'LineStyle', 'none');
title('Counting Steps');
xlabel('Time (s)');
ylabel('Acceleration Magnitude, Gravity Removed (m/s^2)');
hold off;
Step 6: Clean Up
Once you are done, make sure you turn off the acceleration sensor and clear the mobiledev object.
m.AccelerationSensorEnabled = 0;
clear m;
Try it out!
To learn more about acquiring data from sensors on your mobile device, refer to the following links:- Acquiring Data from Sensors - MATLAB Mobile
- Android Sensor Support from MATLAB
- Documentation for mobiledev Object
Let us know by leaving a comment below.
Published with MATLAB® R2014b
- Category:
- MATLAB Mobile


Comments
To leave a comment, please click here to sign in to your MathWorks Account or create a new one.