
Patterns of Innovation in MATLAB Code – We Are Published!
Over the past few years, I have been working with a team at the University of St Andrews on analyzing data from our old MATLAB programming contests. We don’t run these anymore, but across the years we ran, and have data from, twenty different contests. In addition, we have helped the St Andrews folks run two brand new contests of their own. Their team, led by Dr. Elena Miu, was interested in seeing how algorithms and ideas evolve over time as contest participants prod and poke the code into running better and faster.
Dr. Miu wrote a paper about her findings, and I’m delighted to tell you that it was recently published in the prestigious Nature Communications! Because Nature Communications is an open journal, I can link to it here, and you can read it now:
Innovation and cumulative culture through tweaks and leaps in online programming contests
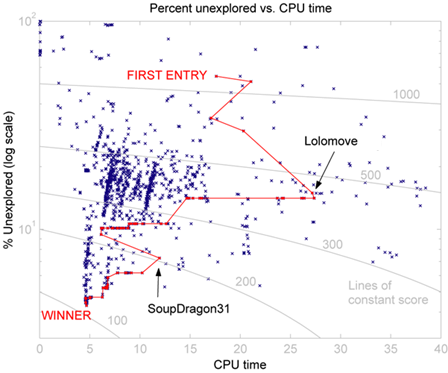
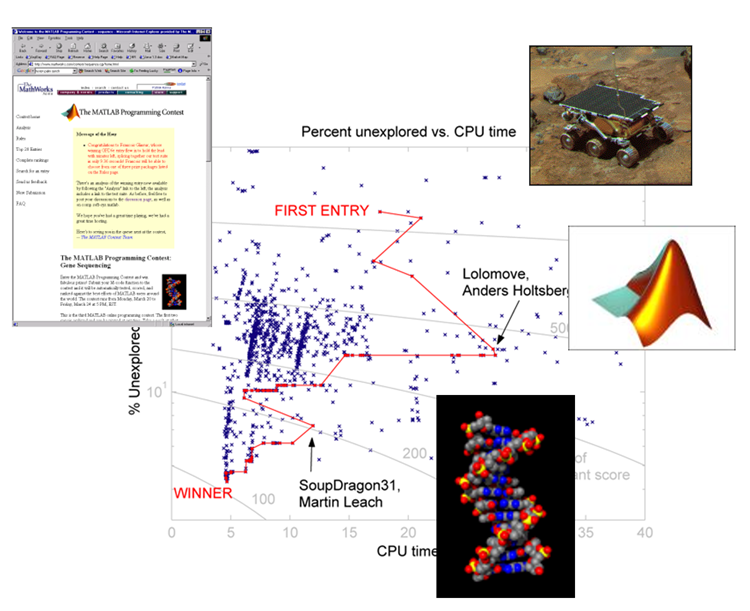
Our MATLAB programming contests, you may remember, have the somewhat unusual feature of making everyone’s code immediately visible to all players. So you might have the leading entry today at noon, but before lunch is over some clever soul will have inspected your code and found a way to improve it. Now they’re in the lead and your glory is already beginning to fade. But that’s okay, because now it’s your turn to check their code for weak spots, make a few changes, and resubmit the entry as your own. And so on. This game play brings in thousands of entries as players scour the code in search of potential improvements. It’s very entertaining to watch.
Because the contest leaves behind a record of mass collaboration (fossilized innovation, you might call it), it’s ideal for studying what Dr. Miu calls “cumulative culture.” That is, “the ability to build progressively on the achievements of earlier generations.” When Dr. Miu analyzed the the contest entries, she found repeated patterns: frequent small changes interspersed with far fewer big changes. A sort of punctuated equilibrium.
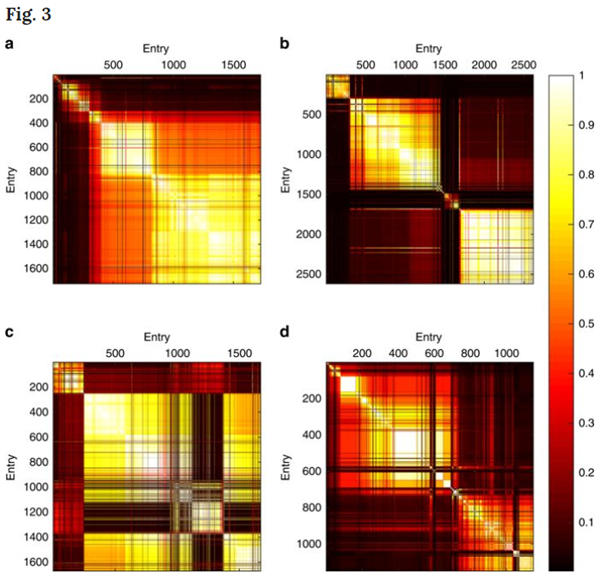
Here is one of the figures from the paper. It’s a set of correlation plots from four different contests. There are more than a thousand entries in each contest. To make the plot, we compare each entry with every other entry in that contest. If the two entries are very similar, we put a light-colored pixel in the plot. If they are completely different, it’s a black pixel. A big white square is thus a period in the contest when the code wasn’t changing much. Conversely, a dark band shows when a dramatic shakeup in the code occurred. My favorite detail: perhaps influenced by the Scottish home of their university, they call these plots “tartan charts.”
The interplay between small changes (tweaks) and big changes (leaps) led to the name of the paper. You can see how it’s different for each contest, yet the basic back-and-forth pattern remains.
Congratulations to Elena Miu and Luke Rendell (also of St Andrews), and my thanks to them for being such pleasant and capable researchers! It’s been a fun project. If you want to learn more about the more recent contests, I’ve written about them several times before, as listed here.


Comments
To leave a comment, please click here to sign in to your MathWorks Account or create a new one.