
Dr. Maeda Wins With MATLAB!
Some people say it's hard to make predictions.
Not true.
But making accurate predictions... okay, that's hard. Even so, some processes are so valuable that even a bad prediction can be worth a lot of money. And if you can improve your current best prediction by even a small amount, it can make a big difference to your business.
Here, for example, are are some things worth knowing in advance.
- How long is that airplane engine going to last?
- When will that machine tool wear out?
- Will the charge in this lithium-ion battery last until I get home?
You can easily imagine why people care a great deal about these. A group in Japan known as ISID (Information Services International-Dentsu, Ltd) has been running a data science competition for the last few years, and these were the very topics for the last three challenges. Today, I want to share with you the story of MATLAB user in Japan who won (tied for first place) in the most recent of these contests. He is Dr. Takafumi Maeda of JFE Steel, and he was interviewed by Michio Inoue of the MathWorks office in Japan. This interview originally appeared in the Japanese blog on MATLAB Central.
Interview with Dr. Maeda
A. Hello! My name is Takafumi Maeda, and I work at a research institute of a manufacturer.
I have been working with MATLAB for more than 15 years since I was an undergraduate. I am very attached to MATLAB, which has always been with me! I am interested in sensor signal processing and data analysis, and I'm also interested in text analysis for processing research papers and patents. What I am addicted to the outside of work is ballet at the gym. I have been enjoying ballet for the past five years because it is mainly basic barre lessons and there are no difficult movements. I tend to bend over when I work on the computer, which makes my posture worse, but the good posture of ballet makes me feel better!
A. I'm usually doing research on predicting abnormalities in manufacturing equipment. I use MATLAB to analyze the data stored by the equipment's pro-controller and sensors and to create diagnostic algorithms.
I started using MATLAB when I was a sophomore in a class on numerical analysis of mechanical dynamics. The assignment was to solve the vibration waveform of a spring, quality point, and damping system structure using the Runge-Kutta method. I remember it was so difficult that I had to ask a friend to show me how to solve it. When I was a student, I knew only C or assembler for microcomputers, so I was impressed by MATLAB's ability to do matrix calculations with short codes.
For the first two years after joining the company, I used Simulink for model-based development to create simulations for motor products, and since then I have been working in data analysis for the past six years.
A. This is the third time I have participated in the competition. I always participate in secret, but my colleagues found out through an ISID e-mail and we participated in secret together (lol).
A. Around 2019, you told me about this competition. At first, I was struggling to predict the failure of jet engines because the data volume was too large and it took a long time to process the data due to the specs of my PC. I participated in the first one and enjoyed it, and I now participate in it every year to improve my skills.
A. The competition for the 2021 ISID was to predict the life of rechargeable batteries and how many more times they would need to be charged before they reach the end of their life. We were given data such as charge current/voltage and discharge current/voltage, so we multiplied the current and voltage to visualize the battery capacity per cycle. The visualization showed that the battery capacity would decrease with each cycle, so we created a model while considering the physical meaning of the data.
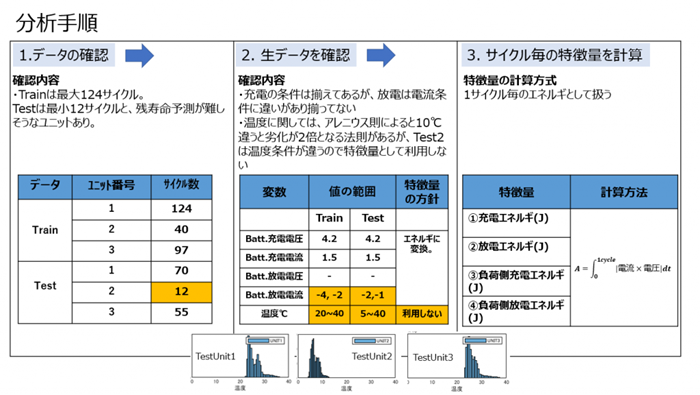
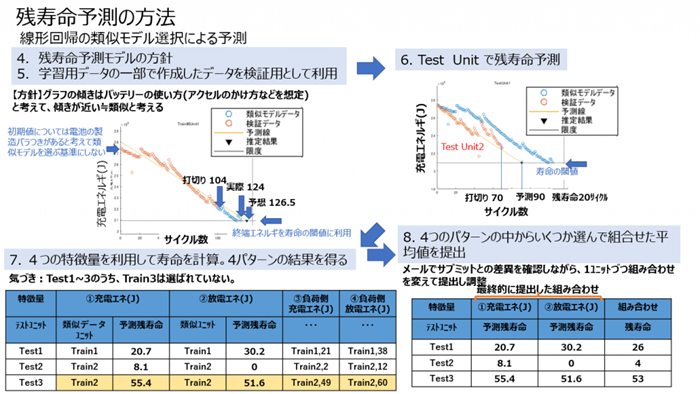
I used a similar model, based on the Predictive Maintenance Toolbox's example of residual life prediction.
There are several mathematical equations involved in converting the raw waveforms of voltage and current to a numerical value of remaining life. I decided to use linear regression because it is better to have a model that can be visually explained to adjust the desired remaining life result. If you put the training data, test data, and the regression curves for them in a graph, you can visually compare whether it was reasonable when you changed the filters, etc.
A. I use the Live Editor for data analysis. By looking at the code and the graph together, I can write down my findings near the chart. I can think about this and that and work quickly and thoughtfully. I also find it helpful to zoom in on the part of the graph that I want to look at, using the mouse on the script.
As I work and the code gets longer, I want to convert it into a function, but I can select the part of the code I want to convert into a function by dragging it and converting it into a function with one click, so I can write code that is easy to read. Since MATLAB came out with the Live Editor, I feel that the productivity of my work has increased.
A. We received a request to introduce MATLAB to new employees and employees temporarily coming to the laboratory from other offices. I introduced them to the fact that it is easy to import data and visualize it in graphs and had them try the tutorial (MATLAB Onramp) that runs in a web browser to recognize it as a tool for quick data analysis.
A. At first, I had trouble with even the simplest of data analysis. When I started the motor analysis, I received a large amount of data from the office, and I didn't have enough time to process it all manually, so I was having trouble getting it done in time for the report.
When I had trouble, I asked my seniors and the MathWorks people to teach me how to use it, and I got the hang of it. From the middle of the course, I started using MATLAB Answers to ask questions, and now I write code by referring to the examples. I think the key to mastery is to think carefully about how to process quickly and efficiently when using it in actual work.
A. Yes, thank you very much for your previous answer. It's so nostalgic to look back 4 years ago. I think MATLAB is a good product and I want to keep using it.


Comments
To leave a comment, please click here to sign in to your MathWorks Account or create a new one.