
Crepuscular Tidings
As the days get shorter and drearier here in New England, I get hungry for sunlight. This makes me somewhat obsessed with when the sun sets. But unlike our ancient ancestors, I don't need to worry that the sun will never return. I have something they didn't have: MATLAB. To cope with the shortening days, I can calculate exactly when the days will start getting longer. And for me, the days will start getting longer on December 10th.
You're probably aware that the shortest day is December 21st. But the earliest sunset is on December 10th (at my latitude). And since I never wake up before dawn, then the day as I experience it is already getting longer by December 11th. It's a subtle point, but it helps carry me through the twilight of the waning year (I've written about this phenomenon before).
Using Francois Beauducel's "Sunrise" contribution on the File Exchange, I can easily make a plot of the sunset time where I live (north latitude 42 degrees).
% Where: Natick, Massachusetts.
lat = 42.3;
lon = -71.4;
% When: this year.
% List all the days of the year
d = datetime(2022,1,1:365);
% SUNRISE uses the DATENUM format
[~,sset_datenum] = sunrise(lat,lon,0,[],datenum(d));
sset = datetime(sset_datenum,ConvertFrom="datenum");
t = hour(sset) + minute(sset)/60 + second(sset)/3600;
plot(d,t,LineWidth=3)
grid on
box on
ylim([15 20])
ylabel("Time of Sunset")
[~,ix] = min(t);
line(sset(ix),t(ix), ...
Marker="o", ...
MarkerSize=15, ...
LineWidth=2, ...
Color="red")
text(sset(ix),t(ix), ...
sprintf("Earliest Sunset \n%s ",sset(ix)), ...
Color="red", ...
VerticalAlignment="bottom", ...
HorizontalAlignment="right")
setTimeYTick(gca)
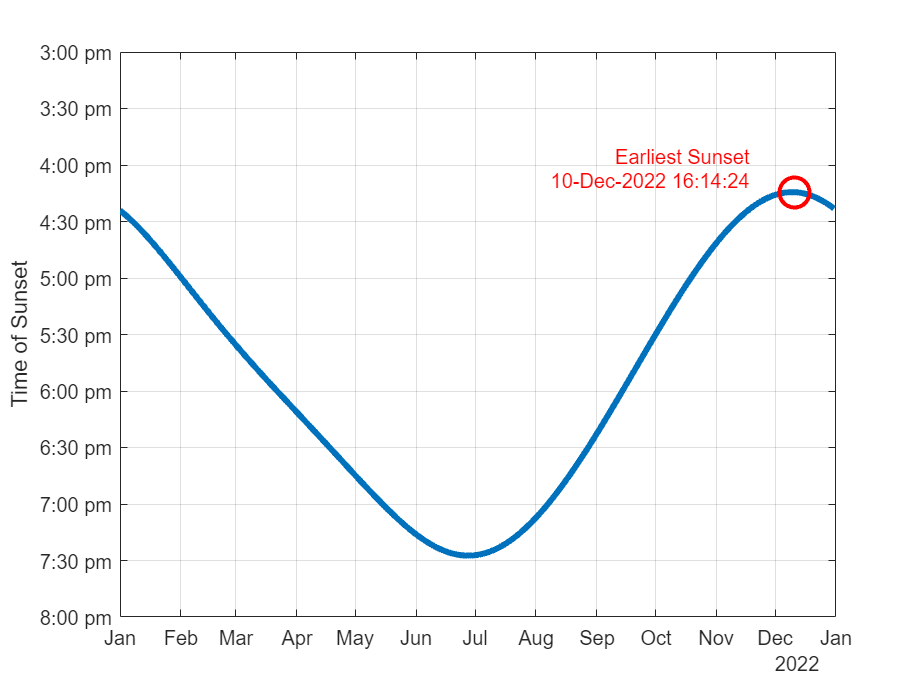
Note that all times are Standard Time. We're not worrying about any Daylight Saving Time nonsense. I like to call the day with the earliest sunset Crepusculus (after crepusculum, the Latin word for dusk). It's an important milestone, so it deserves a name!
Let's take that same data and use it to animate the sunset time using the face of a clock. Here we're visualizing the hour hand at the time of sunset. You can see a little asymmetry here. The days get shorter more quickly than they get longer.
For this animation, I used a File Exchange contribution of my own called Animator.
Now let's plot the span from latest to earliest sunset for several north latitudes.
clf
hold on
latList = 0:10:50;
crepusculusTimes = zeros(size(latList));
crepusculusDates = NaT(size(latList));
colorMap = flipud(parula(10));
for n = 1:length(latList)
d = datetime(2022,1,1:365);
lat = latList(n);
lon = -71;
[~,sset] = sunrise_dt(lat,lon,d);
t = hour(sset)+minute(sset)/60+second(sset)/3600;
[~,ixEarliest] = min(t);
[~,ixLatest] = max(t);
sset = sset(ixLatest:ixEarliest);
crepusculusTimes(n) = t(ixEarliest);
crepusculusDates(n) = d(ixEarliest);
plot(d,t,LineWidth=3,Color=colorMap(n,:))
grid on
hold on
box on
end
legend(string(latList + " deg"),Location="southeast")
title("Sunset Times at Various North Latitudes")
ylabel("Time of Sunset")
setTimeYTick(gca)
hold off
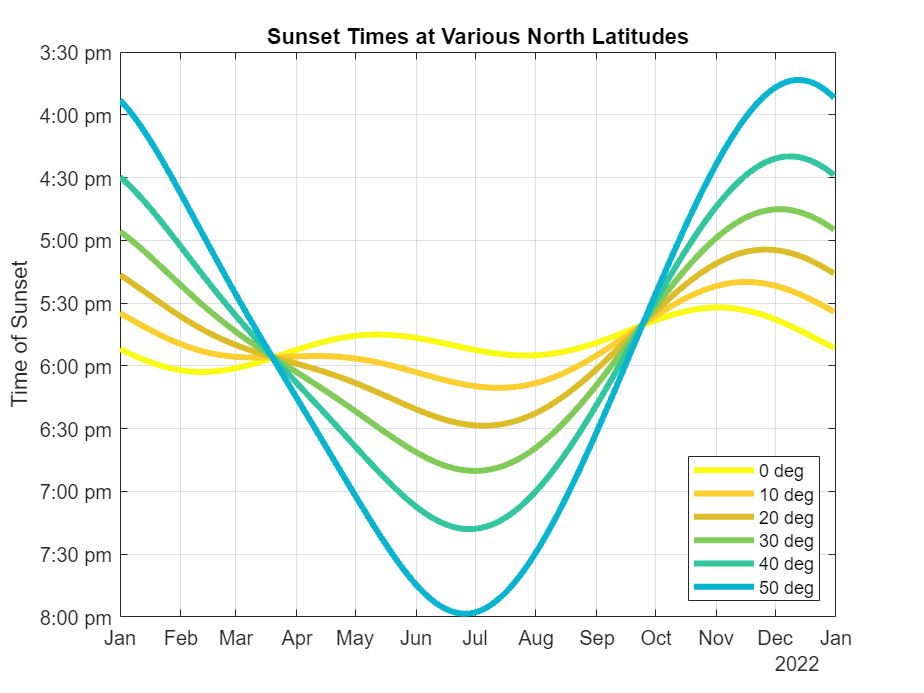
As expected, day length varies considerably as you get farther away from the equator.
legend off
set(findobj(gcf,"Type","line"),LineWidth=1)
h = line(crepusculusDates,crepusculusTimes,LineWidth=2,Color="red",Marker="o");
legend(h,"Crepusculus",Location="southeast")
title("Date of the Earliest Sunset Varies with Latitude")
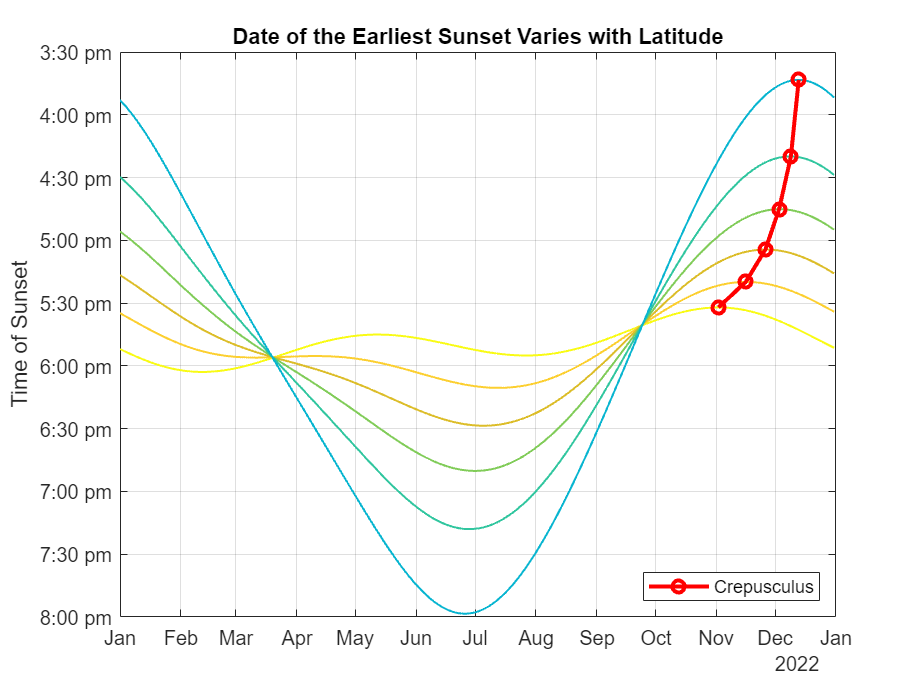
Crepusculus depends on your latitude! The earliest sunset skews earlier in the year as you get closer to the equator.
Once again, let's display some of this information on the face of a clock. This time, instead of an animation, we'll do a static clock face where the color of the hour hand depends on the month of the year.
d = datetime(2022,6,1:214);
lat = 42.3;
lon = -71.4;
[~,sset] = sunrise_dt(lat,lon,d);
t = hour(sset)+minute(sset)/60+second(sset)/3600;
[~,ixEarliest] = min(t);
[~,ixLatest] = max(t);
d = d(ixLatest:ixEarliest);
t = t(ixLatest:ixEarliest);
sset = sset(ixLatest:ixEarliest);
clf
drawClockFace
gammaHr = pi/2 - 2*pi*mod(t,12)/12;
% colorMap = prism(7);
colorMap = get(gca,"ColorOrder");
colorIxList = [1 1 1 1 1 1 2 3 4 5 6 7];
monthList = ["Jan","Feb","Mar","Apr","May","Jun","Jul","Aug","Sep","Oct","Nov","Dec"];
monthList = monthList(unique(month(d)));
h = zeros(12,1);
nMonths = length(unique(month(d)));
r = 0.8;
for i = 1:length(gammaHr)
colorIx = colorIxList(month(d(i)));
% colorIx = colorIxList(i);
color = colorMap(colorIx,:);
h(colorIx) = line([0 r*cos(gammaHr(i))],[0 r*sin(gammaHr(i))], ...
Color=color, ...
LineWidth=2);
end
r = 1.1;
x = r*cos(gammaHr(1));
y = r*sin(gammaHr(1));
line([0 x],[0 y],Color=0.5*[1 1 1])
sset.Format = "dd-MMM HH:mm";
text(x,y,sprintf("Latest Sunset \n%s ", string(sset(1))), ...
Color=0.5*[1 1 1], ...
VerticalAlignment="top", ...
HorizontalAlignment = "right")
x = r*cos(gammaHr(end));
y = r*sin(gammaHr(end));
line([0 x],[0 y],Color=0.5*[1 1 1])
sset.Format = "dd-MMM HH:mm";
text(x,y,sprintf(" Earliest Sunset \n %s ", string(sset(end))), ...
Color=0.5*[1 1 1], ...
VerticalAlignment="top", ...
HorizontalAlignment = "left")
axis equal
axis off
monthList = ["Jan","Feb","Mar","Apr","May","Jun","Jul","Aug","Sep","Oct","Nov","Dec"];
monthList = monthList(unique(month(d)));
h(h==0) = [];
legend(h,monthList, ...
Location="NortheastOutside")
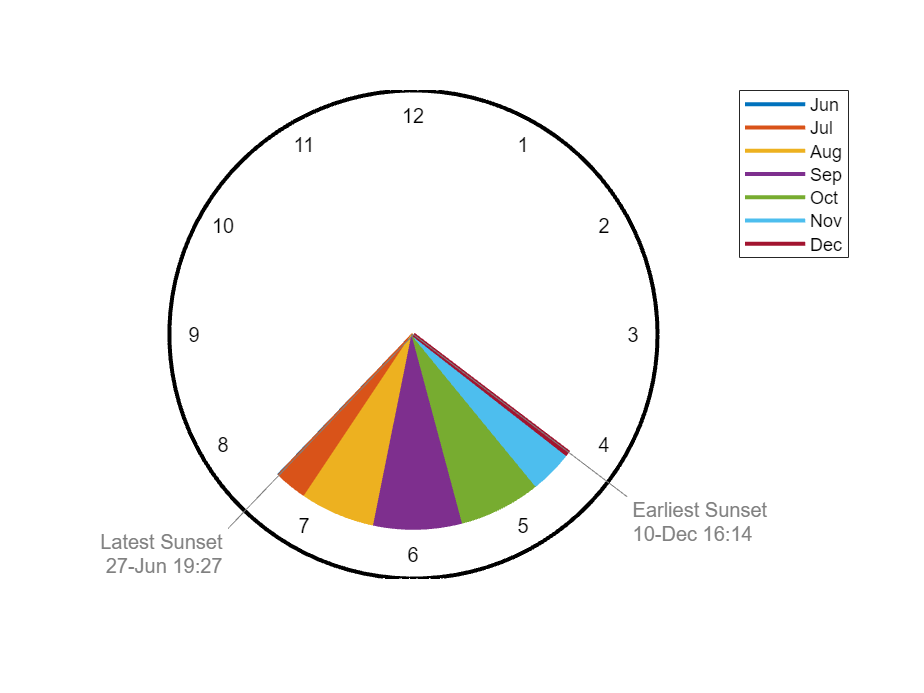
This graph shows roughly half the year, from the latest sunset in June to the earliest sunset in December.
Finally, here's an animation of the sunset visualization shown above as it changes with latitude. Once again, we see that equatorial days don't vary much in length.
Which would you rather have: the steady day length of the tropics, or gloriously long days of summer at the expense of short winter days?
function setTimeYTick(ax)
h = hours(get(ax,"YTick"))-hours(12);
h.Format = "hh:mm";
hStr = replace(string(h), textBoundary+"0", "") + " pm";
set(gca,YTickLabels=hStr, ...
YDir="reverse")
end


Comments
To leave a comment, please click here to sign in to your MathWorks Account or create a new one.