Celebrate pi day with a pi patch
Today's guest article is by Adam Danz whose name you might recognize from the MATLAB Central community. Adam is a developer on the MATLAB Graphics and Charting team. About 20 years ago Adam memorized pi to a measly 200 decimal places which is 1/50 of the digits he'll visualize today using MATLAB.
It's March 14th. Let's get irrational.
Today is pi day, the most popular irrational number at any party, transcendental to all number systems, with an infinite number of decimal places.
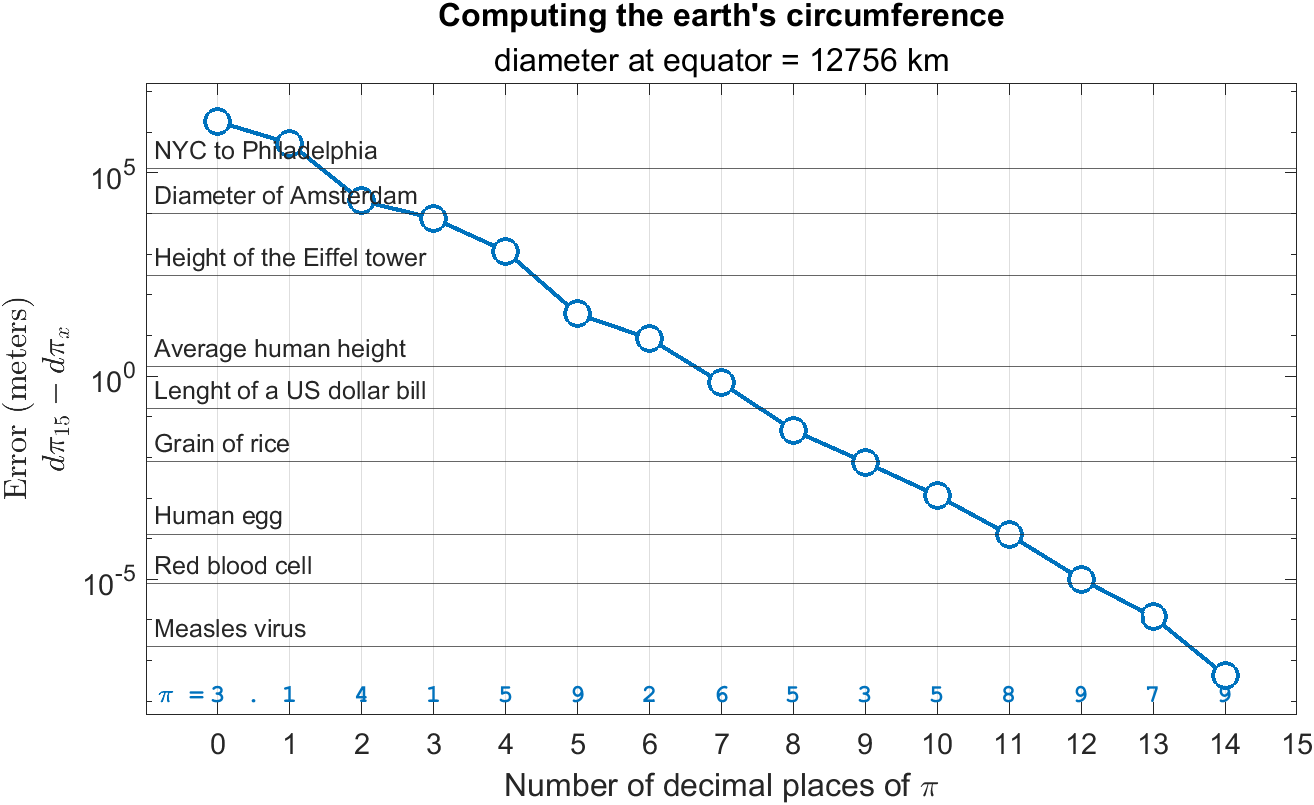
But how many decimal places are needed? NASA's Jet Propulsion Laboratory uses 15 decimal places of pi for interplanetary navigation. With 15 decimals of pi, the earth's circumference can be calculated from its 12756 km (7926 mi) diameter with an error the size of a molecule. The figure below shows the increase in precision (decrease in error) of calculating the earth's circumference as more digits of pi are included in the calculation c=πd.
.

The value of pi in MATLAB, like most other technical computing environments, loses precision after the 15th decimal place due to limitations of floating point arithmetic. To get more than 15 decimal places of pi we can set variable precision that converts symbolic expressions to floating-point numbers, provided by the Symbolic Math Toolbox.
Since we're being irrational, let's get 10,000 decimal places of pi.
% Requires the Symbolic Math toolbox
symExpression = sym(pi); % Symbolic expression; e.g. sym(pi), exp(sym(1)), sym(1/23)
nDecimalPlaces = 10000; % Number of decimal places
decimalChar = char(vpa(mod(abs(symExpression),1),nDecimalPlaces+3))
To use each decimal digit independently, convert the character array to a numeric vector.
decvec = decimalChar(3:end-3) - '0'
Create a pi patch
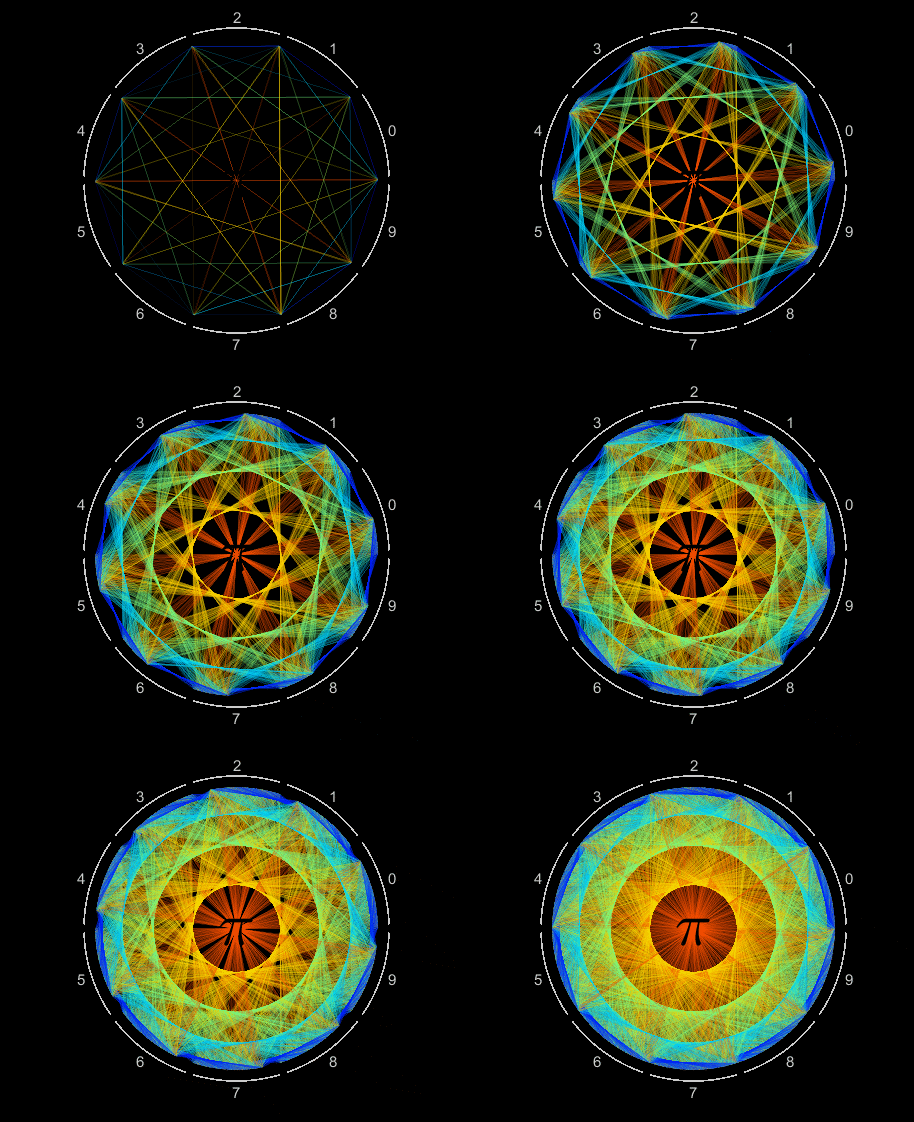
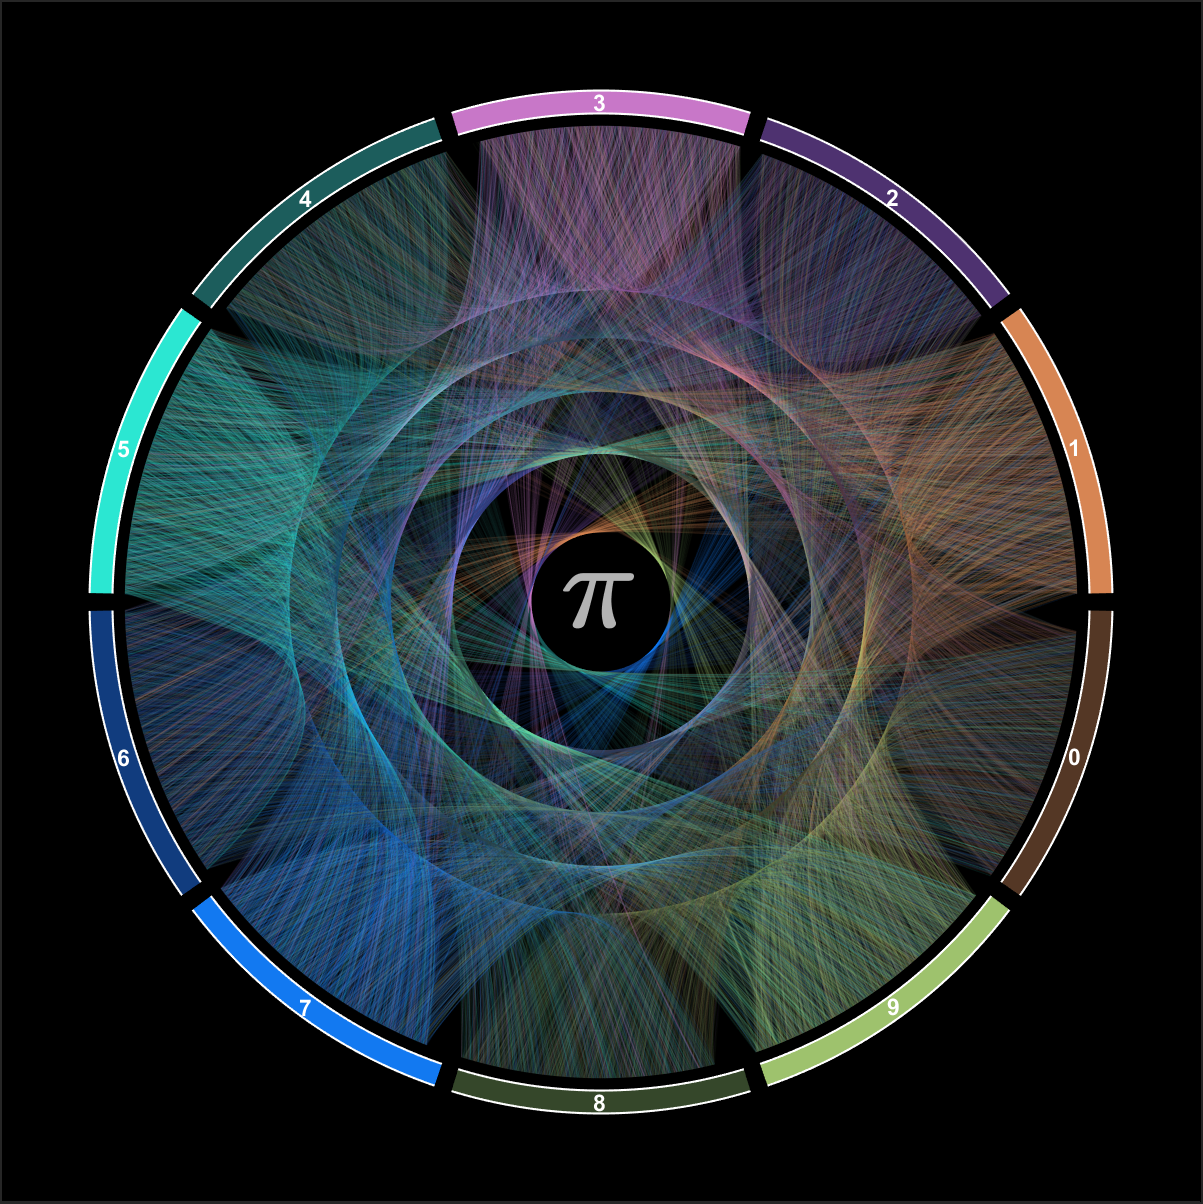
10,000 decimals of pi are efficiently visualized as a single Patch object. Each digit is assigned an angular coordinate evenly distributed within 10 wedges, one wedge for each value 0 to 9. Lines segments connect adjacent digits starting with 1-to-4, 4-to-1, 1-to-5, 5-to-9, 9-to-2 and so on, moving slightly counterclockwise within each wedge. Each line segment is colored according to its length.
% Assign each digit an angular coordinate based on its value 0:9
nDecimals = numel(decvec);
theta = ((0:36:324)+(0:36/nDecimals:36)')*pi/180;
ang = theta(sub2ind(size(theta),1:nDecimals,decvec+1));
% Compute the length of each line segment; used to set color
[x,y] = pol2cart(ang,1);
[~,~,d] = uniquetol(hypot(diff(x),diff(y)));
alpha = min(0.85,max(0.006, 1000/nDecimals));
% Plot line segments using the edge property of a single Patch object
fig = figure(Color='k');
fig.Position(3:4) = 600;
movegui(fig)
ax = axes(fig);
p = patch(ax,XData=x,YData=y,FaceColor='none',EdgeAlpha=alpha);
set(p,'FaceVertexCData', [d;nan], 'EdgeColor','Flat')
colormap(ax,jet(10))
axis equal off
% Add pi character
text(0,0.05,'\pi', ...
HorizontalAlignment='Center', ...
FontUnits='normalized', ...
FontSize = 0.2, ...
Color = 'k');
% wedge lines
th = linspace(0,2*pi,1000);
gaps = 0 : pi/5 : 2*pi;
isgap = any(abs(th-gaps') < pi/120);
th(isgap) = nan;
radius = 1.08;
[segx,segy] = pol2cart(th,radius);
hold on
plot(segx,segy,'-',LineWidth=1,Color=[.8 .8 .8])
% wedge labels
midAng = gaps(1:end-1) + pi/10;
tradius = radius + .08;
[tx,ty] = pol2cart(midAng,tradius);
text(tx, ty, string(0:9), ...,
FontUnits='normalized',...
FontSize=0.05, ...
Color=[.8 .8 .8], ...
HorizontalAlignment='center',...
VerticalAlignment='middle');
To animate the visualization, each line segment was plotted individually and a frame was captured every 200 iterations using getframe, written to a gif file using imwrite with a delay of 0.2 sec.

Visualizing patterns in decimals
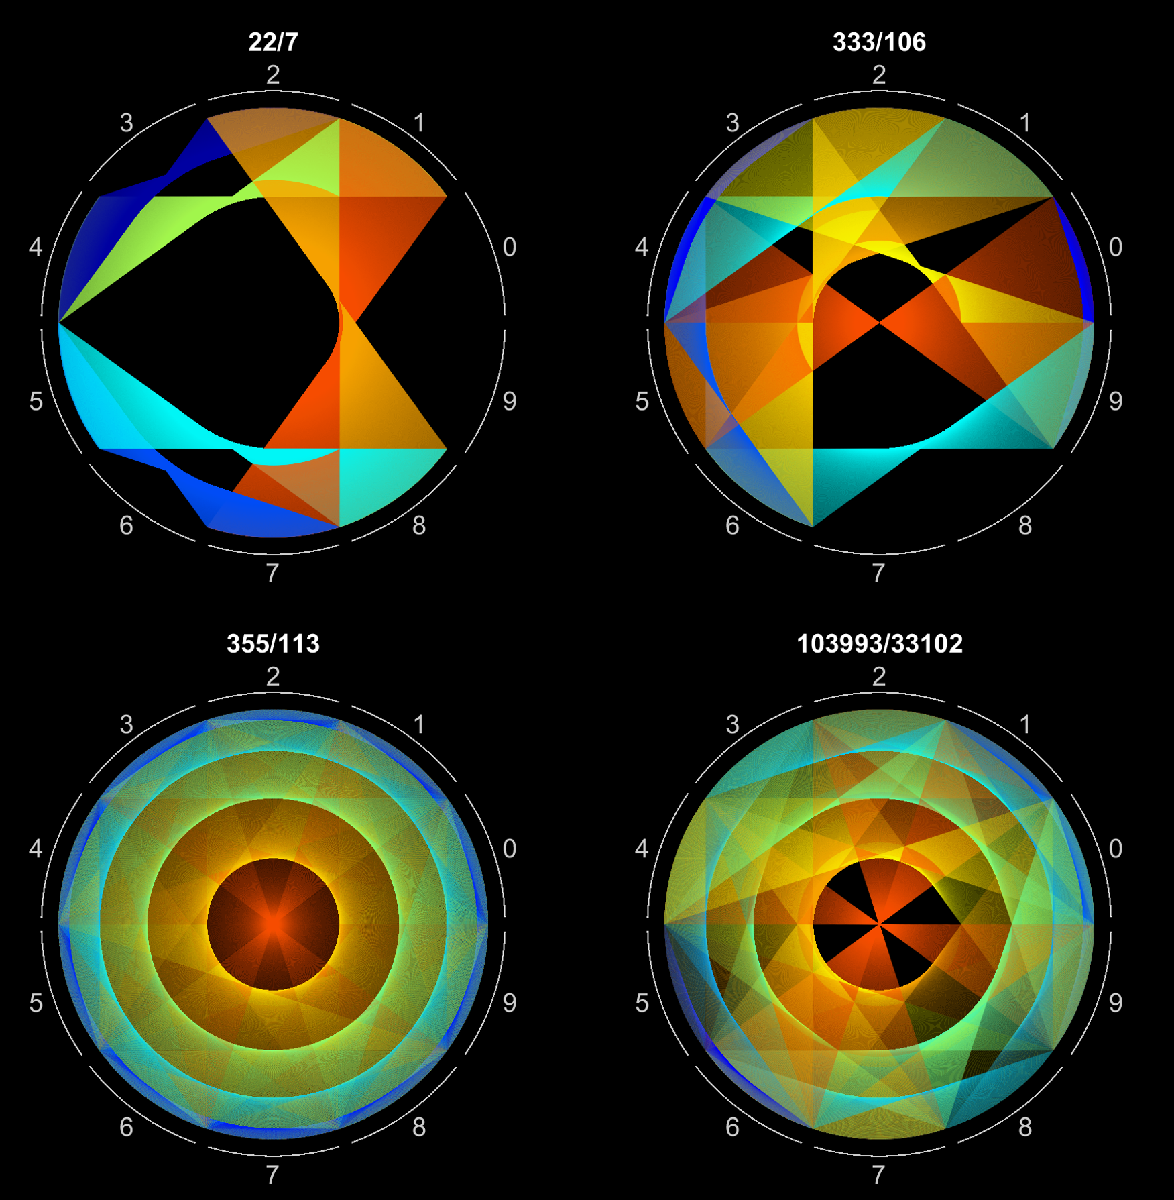
We can use this visualization to investigate patterns in several approximations of pi by replacing the symExpression variable with sym(22/7), sym(333/106), sym(355/113), and sym(103993)/sym(33102).

More fun
- Use the vector of pi digits, decvec, to create a different visual representation of pi.
- Visualize different symbolic expressions by replacing the value in symExpression.
- What would digits of e look like? exp(sym(1))
- How about √2 ? sqrt(sym(2))
- Check out sym(1/9973), sym(1/23), sym(1/42), sym(1/49), sym(1/31), sym(1/61), sym(2/11)
I'd love to see your creations in the comments below!


Comments
To leave a comment, please click here to sign in to your MathWorks Account or create a new one.