
Performance Review Criteria 1: Peer Comparison
Have you ever wondered how to compare the relative speed of two snippets of MATLAB code? Who am I kidding? Of course, we all have. I am just as sure that you already have a solution for this. I know this because all around the internet I have seen people comparing the speed of two algorithms, and everyone does it differently. Also, too many times there are problems with the way it is done and it produces an inaccurate result. For example, often people just rely on straight usage of tic/toc and they gather just one code sample. This sample may be misleading because it can be an outlier or otherwise not truly representative of the expected value of the typical runtime. Also, typically these solutions don't take into account warming up the code. This can also be misleading because one algorithm may take longer to initialize but have better long term performance. Even if the options at play all have the same warmup time, the first algorithm may be penalized with warmup while subsequent algorithms may unfairly benefit from the overall code warmup.
The timeit function definitely helps here, and I am happy when I see these conversations using timeit to measure the code performance. However, even timeit doesn't fit all usage models. While timeit works fantastically for timing snippets of code, it brings along the following considerations:
- Each snippet of code to be measured must be put inside of a function.
- The measured code includes all of the code inside that function, possibly including initialization code.
- It returns a single estimation of the expected value of the runtime rather than a distribution.
- It only measures a single function at any given time. Comparing multiple algorithms requires multiple functions and multiple calls to timeit.
With the performance testing framework in R2016a comes another workflow for comparing the runtime of two (or more) implementations of an algorithm. This can be done quite easily and intuitively by writing a performance test using the script based testing interface.
To demonstrate this I am going to bring back a blast from the past and talk about Sarah's guest post on Loren's blog back in 2008. This post does a great job in describing how to speed up MATLAB code and I think the concepts there are still very applicable. As we talk about this I'd like to show how we can use the code developed in that post to demonstrate how we can easily compare the performance of each of the code improvements she made. While we are at it we can see if the improvements are still improvements in today's MATLAB, and we can see how we do against 2008.
Enough talking, let's get into the code. Well, the nice thing here is that today we can just place all of this code into a simple script based test! In script based testing, the individual tests are separated by code sections (lines beginning with %%). When we use the performance test framework to measure code, we will measure the content in each test section separately.
In fact, we don't even need to produce a separate function to initialize our variables like we did in that post, we can just do this once in the script based test's shared variable section. In a test script, the shared variable section consists of any code that appears before the first explicit code section (the first line beginning with %%). So we can put the entire experiment of Sarah's post into one simple script:
% Performance Test demonstrating Sarah's blog improvements. This can all be
% placed into a single script with the code we want to compare each in
% their own code section. This first section is the shared variable
% section. It will not be measured, but can be used to initialize variables
% that will be available to all code sections independently.

% Initialize the grid and initial and final points
nx1 = 50;
nx2 =  50;
x1l =  0;
x1u = 100;
x2l =  0;
x2u = 100;

x1 = linspace(x1l,x1u,nx1+1);
x2 = linspace(x2l,x2u,nx2+1);

limsf1 = 1:nx1+1;
limsf2 = 1:nx2+1;

limsi1 = limsf1;
limsi2 = limsf2;

% Initialize other variables
t = 1;
sigmax1 = 0.5;
sigmax2 = 1;
sigma = t * [sigmax1^2 0; 0 sigmax2^2];
invSig = inv(sigma);
detSig = det(sigma);

expF = [1 0; 0 1];
n = size (expF, 1);
gausThresh = 10;

small = 0;
subs = [];
vals = [];


%% Initial Code
% The initial code will serve as a baseline and will be the starting point
% for our performance optimizations. This solution iterates through all
% possible initial and final positions and calculates the values of
% exponent and out if exponent > gausThresh.

for i1 = 1:nx1+1
    for i2 = 1:nx2+1
        for f1 = limsf1
            for f2 = limsf2

                % Initial and final position
                xi = [x1(i1) x2(i2)]';
                xf = [x1(f1) x2(f2)]';

                exponent = 0.5 * (xf - expF * xi)'...
                    * invSig * (xf - expF * xi);

                if exponent > gausThresh
                    small = small + 1;
                else
                    out = 1 / (sqrt((2 * pi)^n * detSig))...
                        * exp(-exponent);
                    subs = [subs; i1 i2 f1 f2];
                    vals = [vals; out];
                end

            end
        end
    end
end

%% Code with Preallocation
% Sarah's first improvement was to leverage preallocation to reduce the
% time spent allocating memory and constantly growing the arrays.

% Initial guess for preallocation
mm = min((nx1+1)^2*(nx2+1)^2, 10^6);
subs = zeros(mm,4);
vals = zeros(mm,1);

counter = 0;

% Iterate through all possible initial
% and final positions
for i1 = 1:nx1+1
    for i2 = 1:nx2+1
        for f1 = limsf1
            for f2 = limsf2

                xi = [x1(i1) x2(i2)]'; %% Initial position
                xf = [x1(f1) x2(f2)]'; %% Final position

                exponent = 0.5 * (xf - expF * xi)'...
                    * invSig * (xf - expF * xi);

                % Increase preallocation if necessary
                if counter == length(vals)
                    subs = [subs; zeros(mm, 4)];
                    vals = [vals; zeros(mm, 1)];
                end

                if exponent > gausThresh
                    small = small + 1;
                else
                    % Counter introduced
                    counter=counter + 1;
                    out = 1 / (sqrt((2 * pi)^n * detSig))...
                        * exp(-exponent);
                    subs(counter,:) = [i1 i2 f1 f2];
                    vals(counter) = out;
                end

            end
        end
    end
end

% Remove zero components that came from preallocation
vals = vals(vals > 0);
subs = subs(vals > 0);

%% Vectorize the Inner Two loops
% The second step was to leverage vectorization. Sarah outlines how to
% vectorize the inner two loops to gain substantial speed improvement.

vals = cell(nx1+1,nx2+1); % Cell preallocation
subs = cell(nx1+1,nx2+1); % Cell preallocation

[xind,yind] = meshgrid(limsf1,limsf2);
xyindices = [xind(:)' ; yind(:)'];

[x,y] = meshgrid(x1(limsf1),x2(limsf2));
xyfinal = [x(:)' ; y(:)'];

exptotal = zeros(length(xyfinal),1);

% Loop over all possible combinations of positions
for i1 = 1:nx1+1
    for i2 = 1:nx2+1

        xyinitial = repmat([x1(i1);x2(i2)],1,length(xyfinal));

        expa = 0.5 * (xyfinal - expF * xyinitial);
        expb = invSig * (xyfinal - expF * xyinitial);
        exptotal(:,1) = expa(1,:).*expb(1,:)+expa(2,:).*expb(2,:);

        index = find(exptotal < gausThresh);
        expreduced = exptotal(exptotal < gausThresh);

        out = 1 / (sqrt((2 * pi)^n * detSig)) * exp(-(expreduced));
        vals{i1,i2} = out;
        subs{i1,i2} = [i1*ones(1,length(index)) ; ...
            i2*ones(1,length(index)); xyindices(1,index); ...
            xyindices(2,index)]' ;

    end
end

% Reshape and convert output so it is in a
% simple matrix format
vals = cell2mat(vals(:));
subs = cell2mat(subs(:));

small = ((nx1+1)^2*(nx2+1)^2)-length(subs);

%% Vectorize the Inner Three Loops
% Let's take the vectorization approach one more level and remove all but
% the outermost loop.

% ndgrid gives a matrix of all the possible combinations
[aind,bind,cind] = ndgrid(limsi2,limsf1,limsf2);
[a,b,c] = ndgrid(x2,x1,x2);

vals = cell(nx1+1,nx2+1);  % Cell preallocation
subs = cell(nx1+1,nx2+1);  % Cell preallocation

% Convert grids to single vector to use in a single loop
b = b(:); aind = aind(:); bind = bind(:); cind = cind(:);

expac = a(:)-c(:); % Calculate x2-x1

% Iterate through initial x1 positions (i1)
for i1 = limsi1

    exbx1= b-x1(i1);
    expaux = invSig(2)*exbx1.*expac;
    exponent = 0.5*(invSig(1)*exbx1.*exbx1+expaux);

    index = find(exponent < gausThresh);
    expreduced = exponent(exponent < gausThresh);

    vals{i1} = 1 / (sqrt((2 * pi)^n * detSig))...
        .*exp(-expreduced);

    subs{i1} = [i1*ones(1,length(index));
        aind(index)' ; bind(index)';...
        cind(index)']';

end

vals = cell2mat(vals(:));
subs = cell2mat(subs(:));

small = ((nx1+1)^2*(nx2+1)^2)-length(subs);

%% Final Solution
% Putting it all together, Sarah demonstrated the combination of preallocation,
% vectorization, and reducing unnecessary calculations in the loop.

const=1 / (sqrt((2 * pi)^n * detSig));

% ndgrid gives a matrix of all the possible combinations
% of position, except limsi1 which we iterate over

[aind,bind,cind] = ndgrid(limsi2,limsf1,limsf2);
[a,b,c] = ndgrid(x2,x1,x2);

vals = cell(nx1+1,nx2+1);  % Cell preallocation
subs = cell(nx1+1,nx2+1);  % Cell preallocation

% Convert grids to single vector to
% use in a single for-loop
b = b(:);
aind = aind(:);
bind = bind(:);
cind = cind(:);

expac= a(:)-c(:);
expaux = invSig(2)*expac.*expac;

% Iterate through initial x1 positions

for i1 = limsi1

    expbx1= b-x1(i1);
    exponent = 0.5*(invSig(1)*expbx1.*expbx1+expaux);

    % Find indices where exponent < gausThresh
    index = find(exponent < gausThresh);

    % Find and keep values where exp < gausThresh

    expreduced = exponent(exponent < gausThresh);

    vals{i1} = const.*exp(-expreduced);

    subs{i1} = [i1*ones(1,length(index));
        aind(index)' ; bind(index)';...
        cind(index)']';
end

vals = cell2mat(vals(:));
subs = cell2mat(subs(:));

small = ((nx1+1)^2*(nx2+1)^2)-length(subs);
Sorry for the big code dump. Take a look back at the original post for an in depth explanation of each code section and how they improve upon one another. However, just look at the higher level structure of this code and it implications:
- First of all all of the code is in the same script. This means that all code under question is in close proximity to that being compared.
- We leverage the shared variable section to share common variable definitions. This single sources these definitions to ensure we are comparing apples to apples (actually the blog post originally had a bug in it because these variables weren't single sourced!).
- Since the code is in the same script, each of the steps can be described against each other and published for more streamlined communication.
- You can run it all together at once using the new runperf function!
When you run this with runperf, first the shared variables are run and initialized just once. However, after that each code section is run repeatedly, first to warm up the code in the section and then to gather multiple measurements to ensure that the measurement is robust to statistical sampling error. The function collects enough samples such that the mean of the samples has a 5% relative margin of error with a 95% confidence level. It then returns the full data into a MeasurementResult array for each code snippet. Take a look:
measResult = runperf('comparisonTest')
Running comparisonTest
..........
..........
..........
..........
Done comparisonTest
__________


measResult =

  1x5 MeasurementResult array with properties:

    Name
    Valid
    Samples
    TestActivity

Totals:
   5 Valid, 0 Invalid.
Each element of this result array contains a wealth of information you might want to leverage to analyze the different algorithms' performance. Each element has a name derived from the code section's title to identify each code snippet being analyzed. Also, and importantly, every code snippet's measured sample times are included in the Samples property, which is a MATLAB table containing the measurement information (excluding the samples taken to warm up the code).
measResult.Samples
ans =

               Name               MeasuredTime         Timestamp              Host         Platform           Version                      RunIdentifier
    __________________________    ____________    ____________________    _____________    ________    _____________________    ____________________________________

    comparisonTest/InitialCode    19.032          11-Apr-2016 16:18:21    MyMachineName    maci64      9.0.0.341360 (R2016a)    ef8f9d2d-5028-48ad-ab9f-422f9719b711
    comparisonTest/InitialCode    18.956          11-Apr-2016 16:18:40    MyMachineName    maci64      9.0.0.341360 (R2016a)    ef8f9d2d-5028-48ad-ab9f-422f9719b711
    comparisonTest/InitialCode    19.697          11-Apr-2016 16:19:00    MyMachineName    maci64      9.0.0.341360 (R2016a)    ef8f9d2d-5028-48ad-ab9f-422f9719b711
    comparisonTest/InitialCode    18.802          11-Apr-2016 16:19:19    MyMachineName    maci64      9.0.0.341360 (R2016a)    ef8f9d2d-5028-48ad-ab9f-422f9719b711


ans =

                    Name                    MeasuredTime         Timestamp              Host         Platform           Version                      RunIdentifier
    ____________________________________    ____________    ____________________    _____________    ________    _____________________    ____________________________________

    comparisonTest/CodeWithPreallocation    17.613          11-Apr-2016 16:20:47    MyMachineName    maci64      9.0.0.341360 (R2016a)    ef8f9d2d-5028-48ad-ab9f-422f9719b711
    comparisonTest/CodeWithPreallocation    17.533          11-Apr-2016 16:21:04    MyMachineName    maci64      9.0.0.341360 (R2016a)    ef8f9d2d-5028-48ad-ab9f-422f9719b711
    comparisonTest/CodeWithPreallocation    17.476          11-Apr-2016 16:21:22    MyMachineName    maci64      9.0.0.341360 (R2016a)    ef8f9d2d-5028-48ad-ab9f-422f9719b711
    comparisonTest/CodeWithPreallocation    17.574          11-Apr-2016 16:21:39    MyMachineName    maci64      9.0.0.341360 (R2016a)    ef8f9d2d-5028-48ad-ab9f-422f9719b711


ans =

                      Name                      MeasuredTime         Timestamp              Host         Platform           Version                      RunIdentifier
    ________________________________________    ____________    ____________________    _____________    ________    _____________________    ____________________________________

    comparisonTest/VectorizeTheInnerTwoLoops    0.16654         11-Apr-2016 16:21:40    MyMachineName    maci64      9.0.0.341360 (R2016a)    ef8f9d2d-5028-48ad-ab9f-422f9719b711
    comparisonTest/VectorizeTheInnerTwoLoops    0.16728         11-Apr-2016 16:21:41    MyMachineName    maci64      9.0.0.341360 (R2016a)    ef8f9d2d-5028-48ad-ab9f-422f9719b711
    comparisonTest/VectorizeTheInnerTwoLoops    0.16495         11-Apr-2016 16:21:41    MyMachineName    maci64      9.0.0.341360 (R2016a)    ef8f9d2d-5028-48ad-ab9f-422f9719b711
    comparisonTest/VectorizeTheInnerTwoLoops    0.16462         11-Apr-2016 16:21:41    MyMachineName    maci64      9.0.0.341360 (R2016a)    ef8f9d2d-5028-48ad-ab9f-422f9719b711


ans =

                       Name                       MeasuredTime         Timestamp              Host         Platform           Version                      RunIdentifier
    __________________________________________    ____________    ____________________    _____________    ________    _____________________    ____________________________________

    comparisonTest/VectorizeTheInnerThreeLoops    0.054535        11-Apr-2016 16:21:41    MyMachineName    maci64      9.0.0.341360 (R2016a)    ef8f9d2d-5028-48ad-ab9f-422f9719b711
    comparisonTest/VectorizeTheInnerThreeLoops    0.053873        11-Apr-2016 16:21:41    MyMachineName    maci64      9.0.0.341360 (R2016a)    ef8f9d2d-5028-48ad-ab9f-422f9719b711
    comparisonTest/VectorizeTheInnerThreeLoops    0.053708        11-Apr-2016 16:21:41    MyMachineName    maci64      9.0.0.341360 (R2016a)    ef8f9d2d-5028-48ad-ab9f-422f9719b711
    comparisonTest/VectorizeTheInnerThreeLoops      0.0535        11-Apr-2016 16:21:41    MyMachineName    maci64      9.0.0.341360 (R2016a)    ef8f9d2d-5028-48ad-ab9f-422f9719b711


ans =

                Name                MeasuredTime         Timestamp              Host         Platform           Version                      RunIdentifier
    ____________________________    ____________    ____________________    _____________    ________    _____________________    ____________________________________

    comparisonTest/FinalSolution    0.051026        11-Apr-2016 16:21:42    MyMachineName    maci64      9.0.0.341360 (R2016a)    ef8f9d2d-5028-48ad-ab9f-422f9719b711
    comparisonTest/FinalSolution    0.050669        11-Apr-2016 16:21:42    MyMachineName    maci64      9.0.0.341360 (R2016a)    ef8f9d2d-5028-48ad-ab9f-422f9719b711
    comparisonTest/FinalSolution    0.050521        11-Apr-2016 16:21:42    MyMachineName    maci64      9.0.0.341360 (R2016a)    ef8f9d2d-5028-48ad-ab9f-422f9719b711
    comparisonTest/FinalSolution    0.052291        11-Apr-2016 16:21:42    MyMachineName    maci64      9.0.0.341360 (R2016a)    ef8f9d2d-5028-48ad-ab9f-422f9719b711
As you can see above each of the tables are separate for each code section being measured, but are just begging to be concatenated together into one table:
allSamples = vertcat(measResult.Samples)
allSamples =

                       Name                       MeasuredTime         Timestamp              Host         Platform           Version                      RunIdentifier
    __________________________________________    ____________    ____________________    _____________    ________    _____________________    ____________________________________

    comparisonTest/InitialCode                      19.032        11-Apr-2016 16:18:21    MyMachineName    maci64      9.0.0.341360 (R2016a)    ef8f9d2d-5028-48ad-ab9f-422f9719b711
    comparisonTest/InitialCode                      18.956        11-Apr-2016 16:18:40    MyMachineName    maci64      9.0.0.341360 (R2016a)    ef8f9d2d-5028-48ad-ab9f-422f9719b711
    comparisonTest/InitialCode                      19.697        11-Apr-2016 16:19:00    MyMachineName    maci64      9.0.0.341360 (R2016a)    ef8f9d2d-5028-48ad-ab9f-422f9719b711
    comparisonTest/InitialCode                      18.802        11-Apr-2016 16:19:19    MyMachineName    maci64      9.0.0.341360 (R2016a)    ef8f9d2d-5028-48ad-ab9f-422f9719b711
    comparisonTest/CodeWithPreallocation            17.613        11-Apr-2016 16:20:47    MyMachineName    maci64      9.0.0.341360 (R2016a)    ef8f9d2d-5028-48ad-ab9f-422f9719b711
    comparisonTest/CodeWithPreallocation            17.533        11-Apr-2016 16:21:04    MyMachineName    maci64      9.0.0.341360 (R2016a)    ef8f9d2d-5028-48ad-ab9f-422f9719b711
    comparisonTest/CodeWithPreallocation            17.476        11-Apr-2016 16:21:22    MyMachineName    maci64      9.0.0.341360 (R2016a)    ef8f9d2d-5028-48ad-ab9f-422f9719b711
    comparisonTest/CodeWithPreallocation            17.574        11-Apr-2016 16:21:39    MyMachineName    maci64      9.0.0.341360 (R2016a)    ef8f9d2d-5028-48ad-ab9f-422f9719b711
    comparisonTest/VectorizeTheInnerTwoLoops       0.16654        11-Apr-2016 16:21:40    MyMachineName    maci64      9.0.0.341360 (R2016a)    ef8f9d2d-5028-48ad-ab9f-422f9719b711
    comparisonTest/VectorizeTheInnerTwoLoops       0.16728        11-Apr-2016 16:21:41    MyMachineName    maci64      9.0.0.341360 (R2016a)    ef8f9d2d-5028-48ad-ab9f-422f9719b711
    comparisonTest/VectorizeTheInnerTwoLoops       0.16495        11-Apr-2016 16:21:41    MyMachineName    maci64      9.0.0.341360 (R2016a)    ef8f9d2d-5028-48ad-ab9f-422f9719b711
    comparisonTest/VectorizeTheInnerTwoLoops       0.16462        11-Apr-2016 16:21:41    MyMachineName    maci64      9.0.0.341360 (R2016a)    ef8f9d2d-5028-48ad-ab9f-422f9719b711
    comparisonTest/VectorizeTheInnerThreeLoops    0.054535        11-Apr-2016 16:21:41    MyMachineName    maci64      9.0.0.341360 (R2016a)    ef8f9d2d-5028-48ad-ab9f-422f9719b711
    comparisonTest/VectorizeTheInnerThreeLoops    0.053873        11-Apr-2016 16:21:41    MyMachineName    maci64      9.0.0.341360 (R2016a)    ef8f9d2d-5028-48ad-ab9f-422f9719b711
    comparisonTest/VectorizeTheInnerThreeLoops    0.053708        11-Apr-2016 16:21:41    MyMachineName    maci64      9.0.0.341360 (R2016a)    ef8f9d2d-5028-48ad-ab9f-422f9719b711
    comparisonTest/VectorizeTheInnerThreeLoops      0.0535        11-Apr-2016 16:21:41    MyMachineName    maci64      9.0.0.341360 (R2016a)    ef8f9d2d-5028-48ad-ab9f-422f9719b711
    comparisonTest/FinalSolution                  0.051026        11-Apr-2016 16:21:42    MyMachineName    maci64      9.0.0.341360 (R2016a)    ef8f9d2d-5028-48ad-ab9f-422f9719b711
    comparisonTest/FinalSolution                  0.050669        11-Apr-2016 16:21:42    MyMachineName    maci64      9.0.0.341360 (R2016a)    ef8f9d2d-5028-48ad-ab9f-422f9719b711
    comparisonTest/FinalSolution                  0.050521        11-Apr-2016 16:21:42    MyMachineName    maci64      9.0.0.341360 (R2016a)    ef8f9d2d-5028-48ad-ab9f-422f9719b711
    comparisonTest/FinalSolution                  0.052291        11-Apr-2016 16:21:42    MyMachineName    maci64      9.0.0.341360 (R2016a)    ef8f9d2d-5028-48ad-ab9f-422f9719b711
Great, now we have all the data together, and using varfun we can now you can apply whatever statistic we prefer on these samples to get an easy comparison. This is important because sometimes we want to actually observe the expected value of the performance so we would leverage the mean. However, you may want to use median to be more robust to outliers. Another preference may be to recognize that performance noise is additive so a case can be made for using the min, and even using max might be desired to get a better idea of worst case performance. The resulting data structure gives you all the samples collected and lets you decide how you'd like to analyze it. Let's do this today with the median. This is done by using varfun with the InputVariables set to MeasuredTime and the GroupingVariables set to the Name for each separate code snippet we are comparing:
overView = varfun(@median, allSamples, ...
    'InputVariables', 'MeasuredTime', 'GroupingVariables', 'Name')
overView =

                       Name                       GroupCount    median_MeasuredTime
    __________________________________________    __________    ___________________

    comparisonTest/InitialCode                    4               18.994
    comparisonTest/CodeWithPreallocation          4               17.554
    comparisonTest/VectorizeTheInnerTwoLoops      4              0.16574
    comparisonTest/VectorizeTheInnerThreeLoops    4             0.053791
    comparisonTest/FinalSolution                  4             0.050847
There we go, we have a concise high level view of each of our algorithms' performance by calling runperf on our script and taking the median of the MeasuredTime. This script can also be published for communication of our options so we can describe the differences clearly and weigh things like code readability against code performance:

So how did we do against 2008? Sarah's recommendations still hold true, and each of her improvements still produce a corresponding improvement in the runtime performance. Also, if you compare the runtimes of these code snippets since 2008 you can see that the overall times for all algorithms are substantially faster (with nx1 = nx2 =50). Woot Woot! While this is certainly an unfair characteristic since I am not running this performance analysis on the same hardware that Sarah did 8 years ago, it still is encouraging to see progress, both including advancements in hardware as well as the wealth of performance improvements applied to MATLAB over the years, not least including the new execution engine in R2015b. I did the same thing for nx1 = nx2 = 100, and it also showed both significant improvement and consistency:
load n100Results.mat
n100Comparison
n100Comparison =

                       Name                       GroupCount    median_MeasuredTime
    __________________________________________    __________    ___________________

    comparisonTest/InitialCode                    4             888.36
    comparisonTest/CodeWithPreallocation          4             271.55
    comparisonTest/VectorizeTheInnerTwoLoops      4              2.817
    comparisonTest/VectorizeTheInnerThreeLoops    4             1.2057
    comparisonTest/FinalSolution                  4             1.0468
Here is one more quick trick. Rather than seeing a single statistical value for each algorithm, we have access to all measured points so we can see the distribution. Note that in this case the actual distribution is somewhat less interesting because of the low sample sizes we needed to achieve the relative margin of error, but it does provide some extra insight, especially with larger sample sizes.
ax = axes;
hold(ax);
for result = measResult
    h = histogram(ax, result.Samples.MeasuredTime, 'BinWidth',  0.025*median(result.Samples.MeasuredTime));
end
legend(measResult.Name,'Location','SouthOutside');
Current plot held
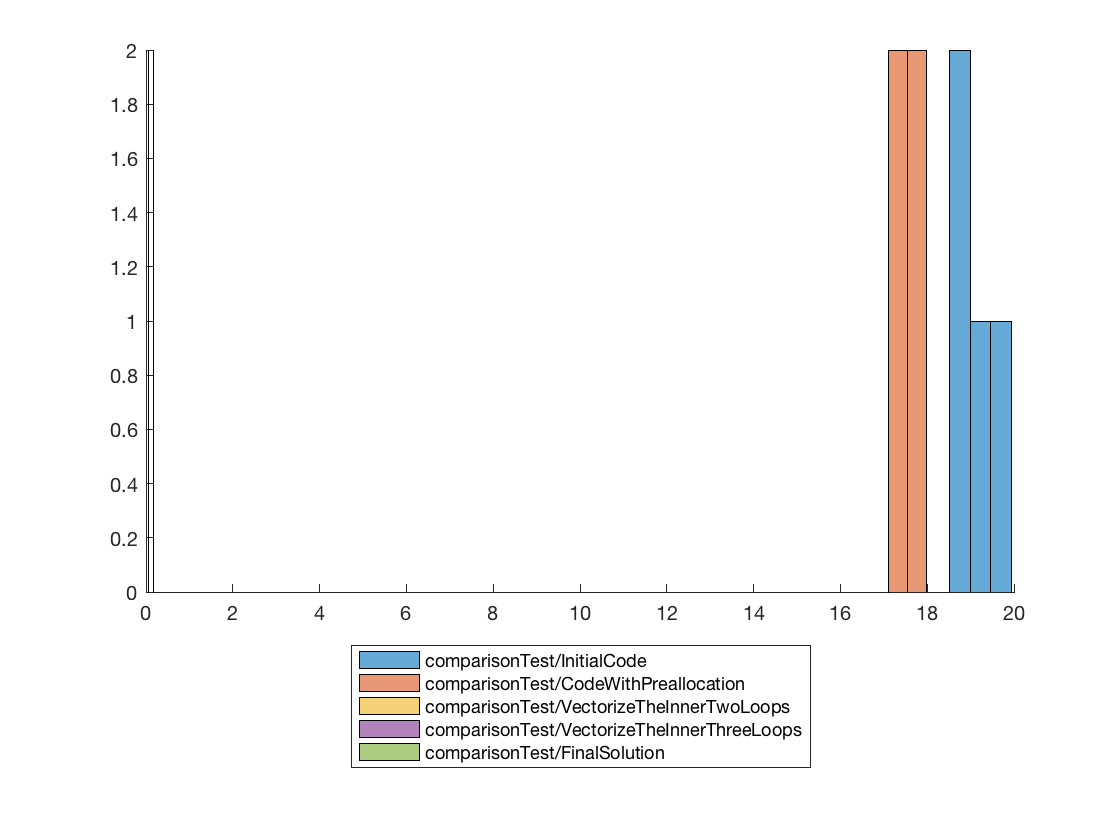
Note because Sarah improved the code so drastically and we are talking orders of magnitude here, we need to use a log scale on the x axis to see all the different distributions clearly. Nice!
ax.XScale = 'log';

How have you measured performance of two algorithms against each other in the past? Do you see this as helping in your performance analysis workflows? Let me know your thoughts in the comments.
- Category:
- Performance,
- Testing


See Also
-

Just Keep Swimming
Blogs
-
Trending Now!
Blogs
-
-
-

Comments
To leave a comment, please click here to sign in to your MathWorks Account or create a new one.